2 min read
05/25/2018
Mind The Graph Scientific Blog is meant to help scientists learn how to communicate science in an uncomplicated way.
May is the skin cancer awareness month. It’s very important talk about it, because skin cancer is the most common cancer and the ultraviolet light exposure is the main ambiental factor. However, is also one of the most preventable forms of cancer. With an early diagnosis, when it’s small and has not spread, skin cancer is much […]
Somos uma plataforma online para cientistas que desejam criar resumos gráficos, apresentações e infográficos. Com […]
International Business Machines (IBM) is one of the most important technological companies in the information technology field. […]
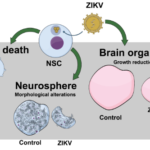
May is the celiac-awareness month, a date to call attention to celiac disease. Researchers from […]
It is always good to communicate new features in Mind the Graph. Our team is […]
The mother’s day falls on different days depending on the countries where it is celebrated. […]
It is mother’s day in several contries around the world and we want to celebrate […]
Most people think about scientists as information generators and forget about their role in communication. […]
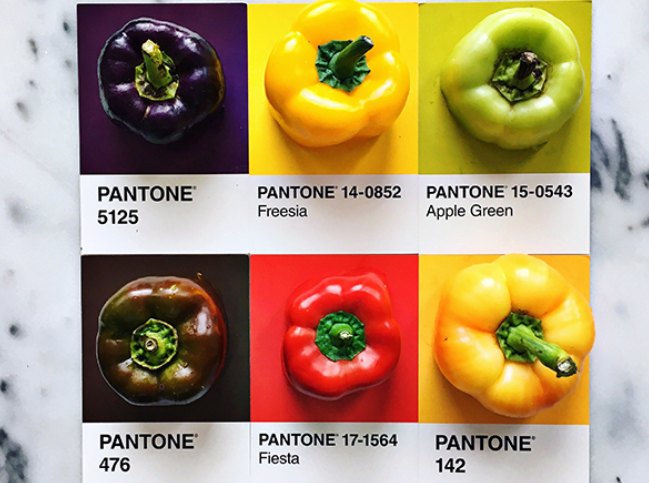
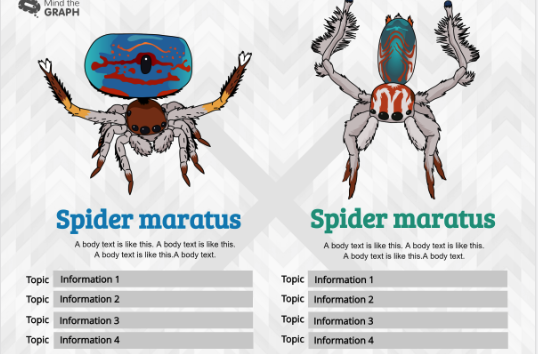
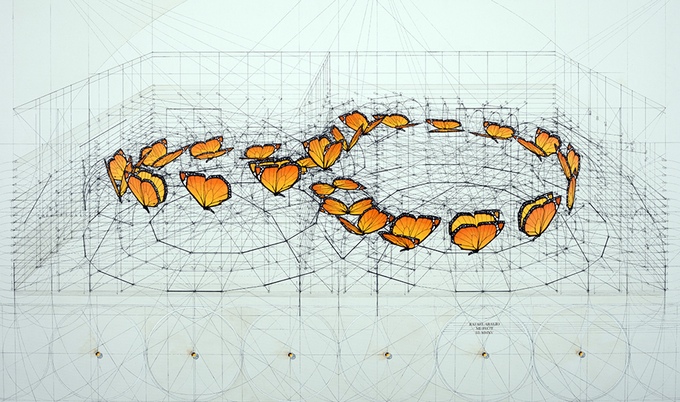
Nature is full of mesmerizing patterns. These patterns challenge scientists to think how evolution could […]
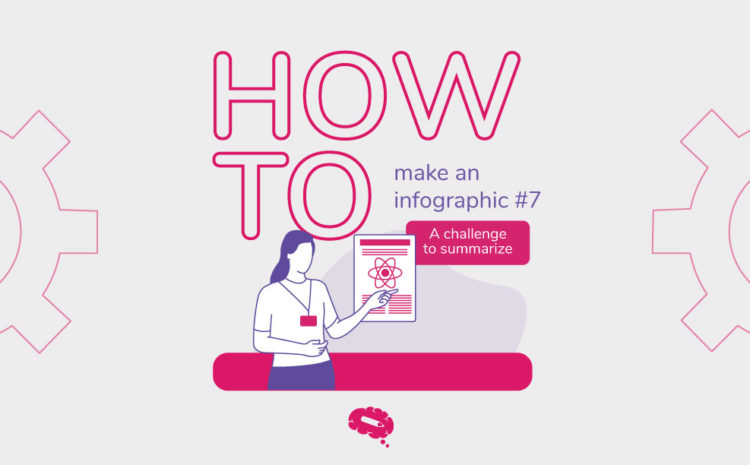
This is the seventh post in the series How to make an infographic. If you missed the last […]
This is the sixth post in the series How to make an infographic. If you […]
This is the fifth post in the series How to make an infographic. If you […]
This is the fourth post in the series How to make an infographic. If you missed […]