4 min read
03/28/2019
Mind The Graph Scientific Blog is meant to help scientists learn how to communicate science in an uncomplicated way.
Many scientific maganizes already request a graphical abstract to publish a paper and others suggest as an option to reach more people. As science communication become more important than ever, graphical abstracts and illustrations are powerful tools for scientists. However, a study of Atanasov and collaborators, shows that if are doing a graphical abstract, better take care that […]
If you are a scientist, you know sometimes it is very difficult to find accurate […]
There is an outdated ideia that the life of a scientist is to be isoled, […]
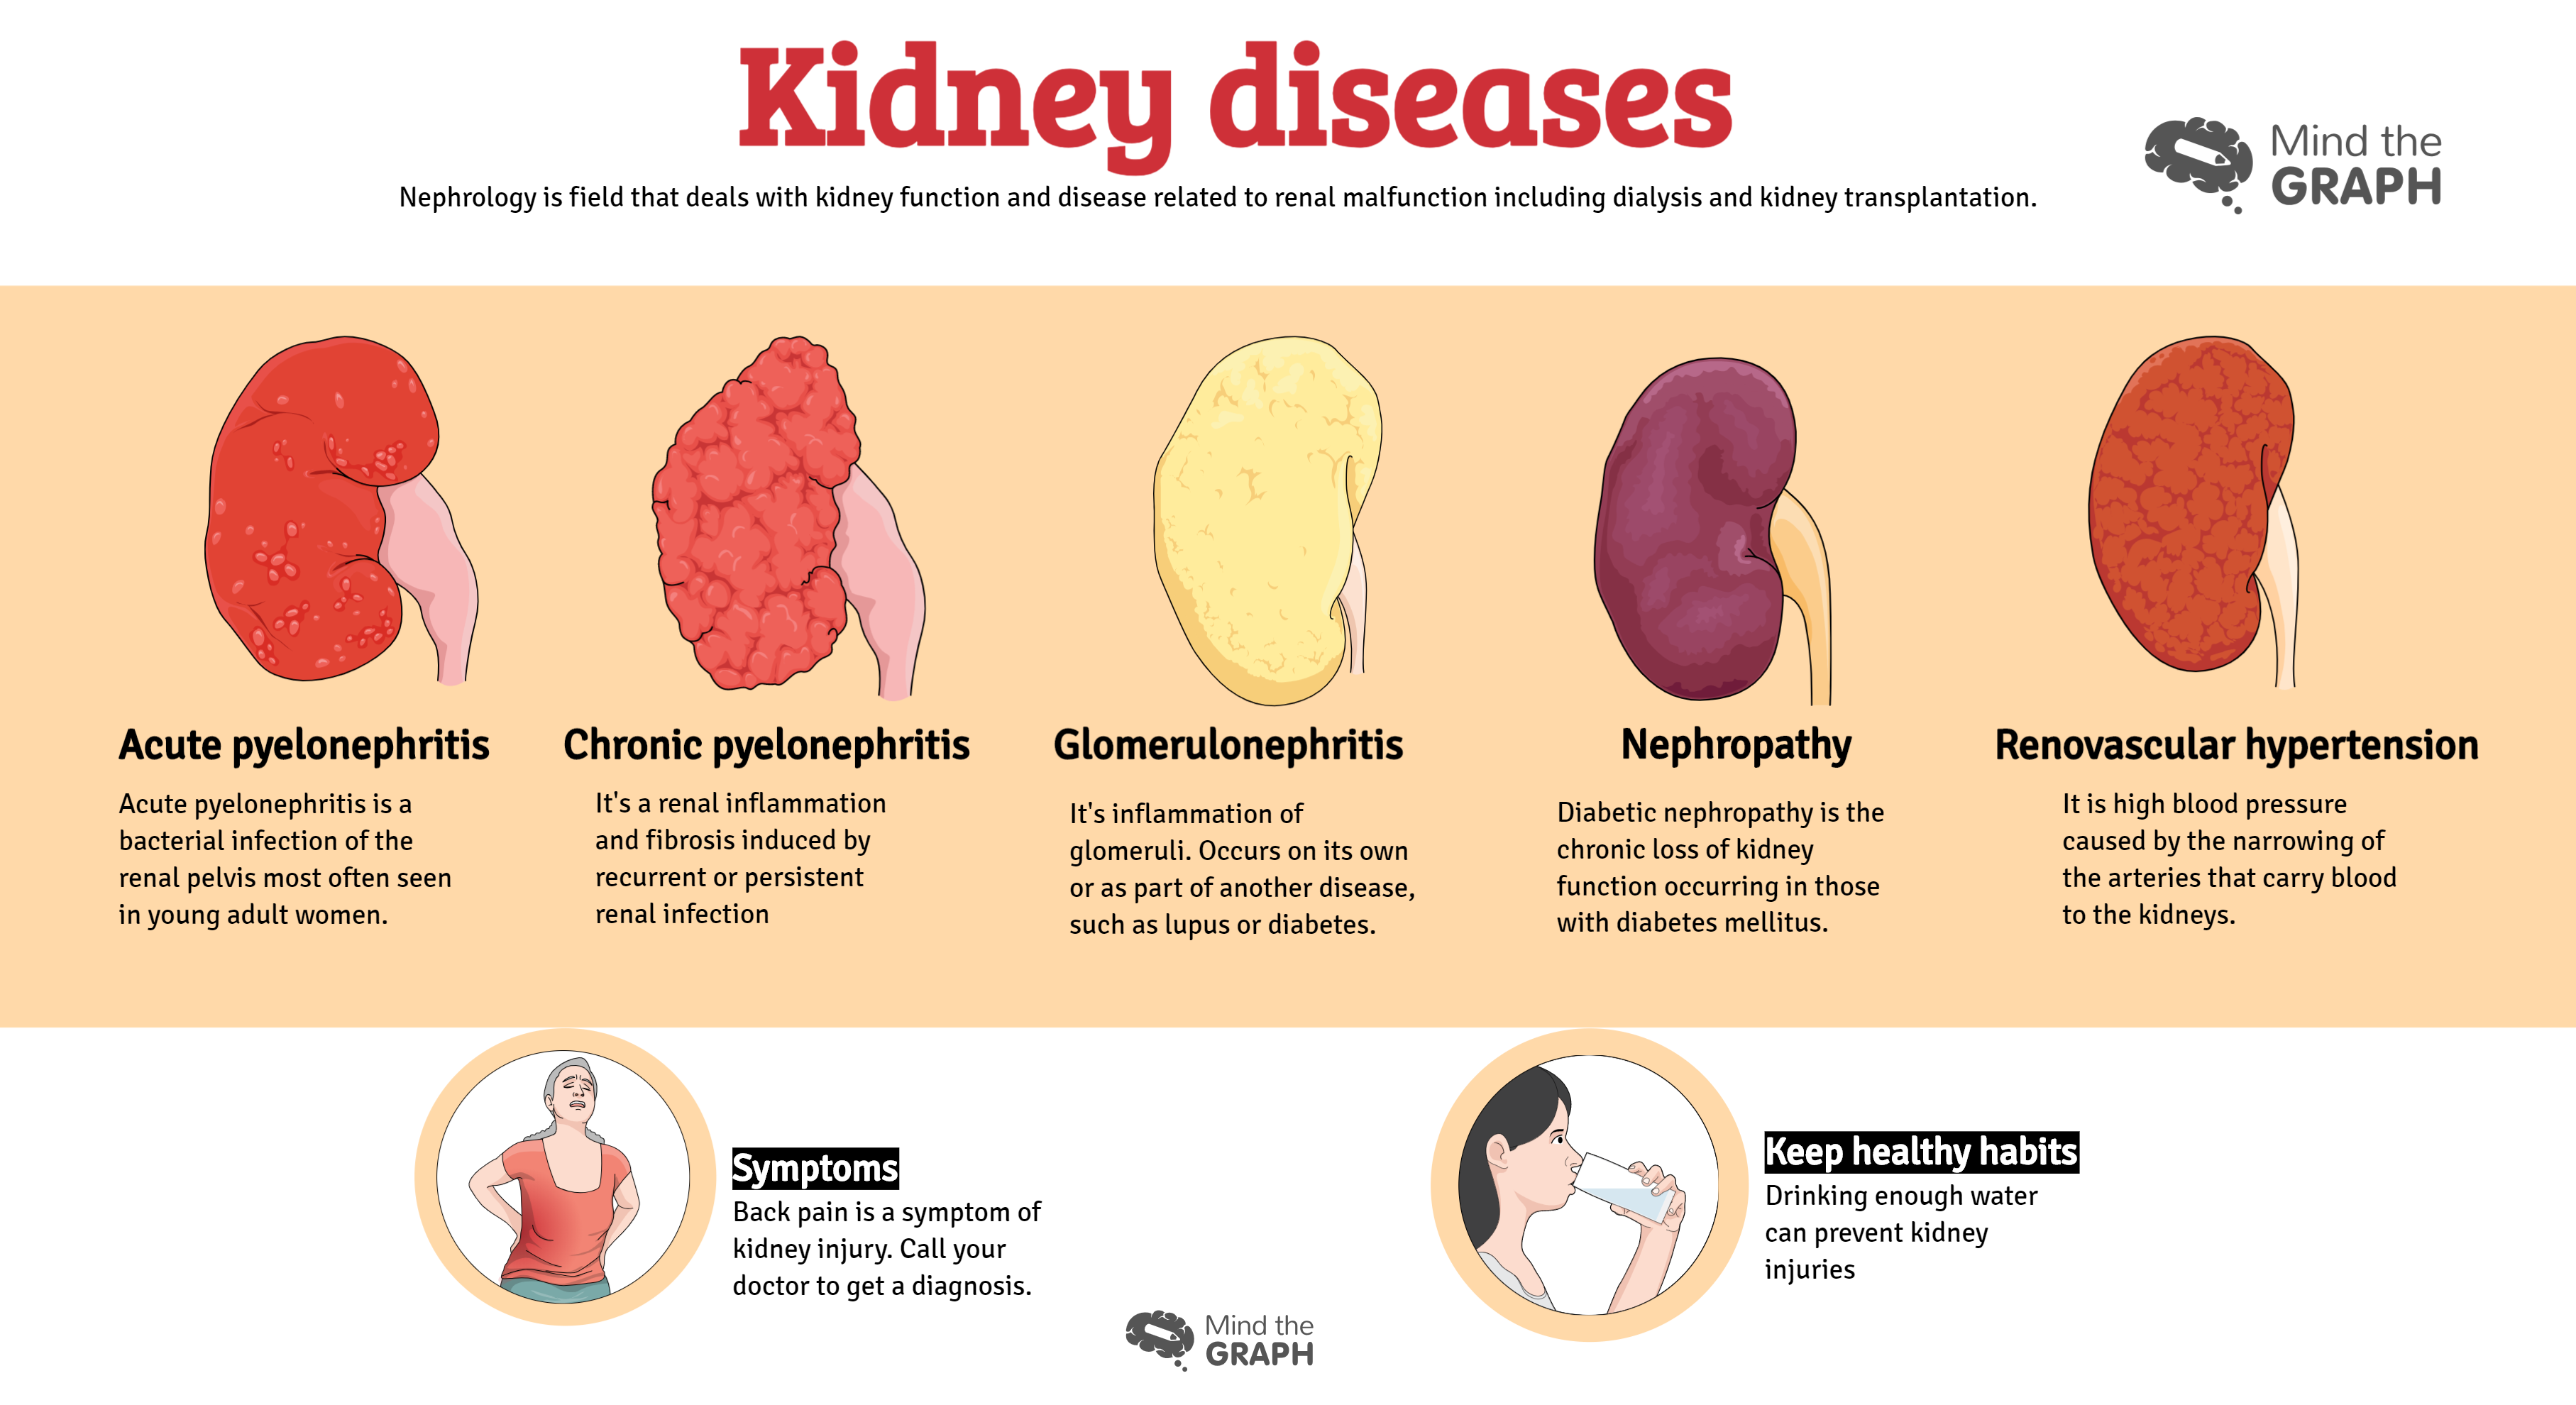
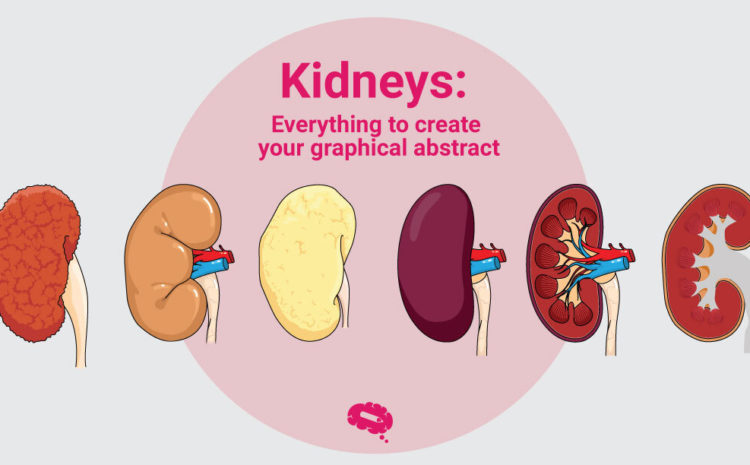
The urinary system works with the lungs, skin and intestines to maintain the balance of […]
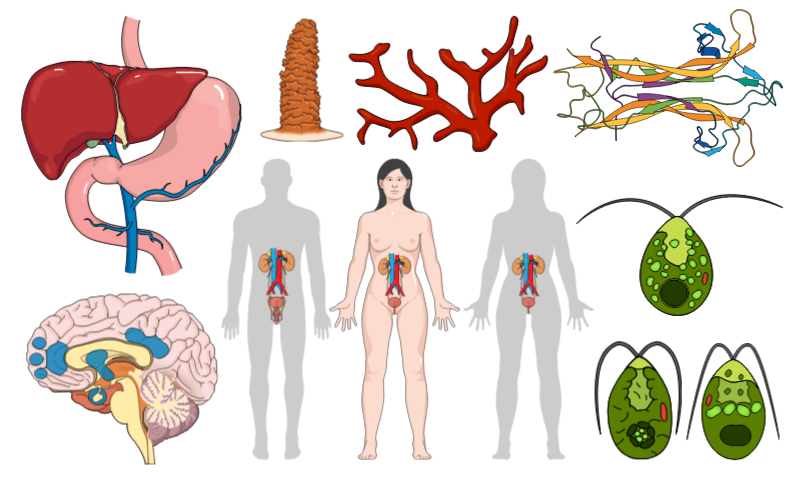
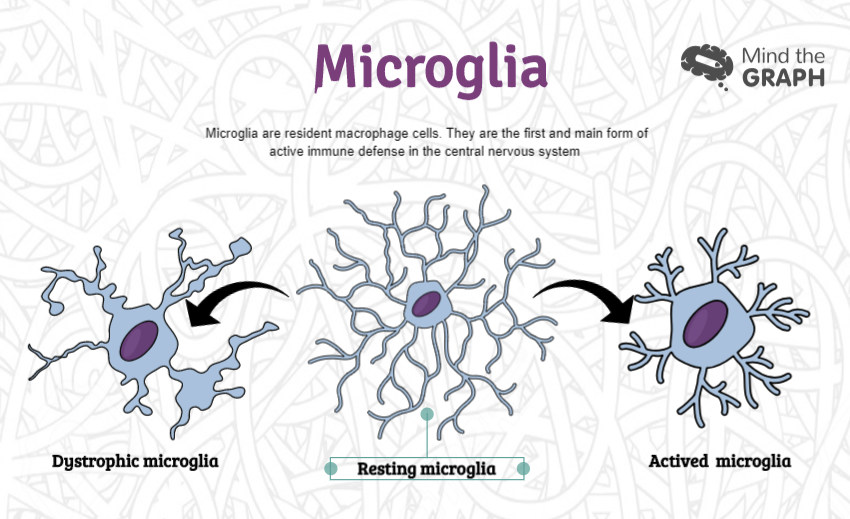
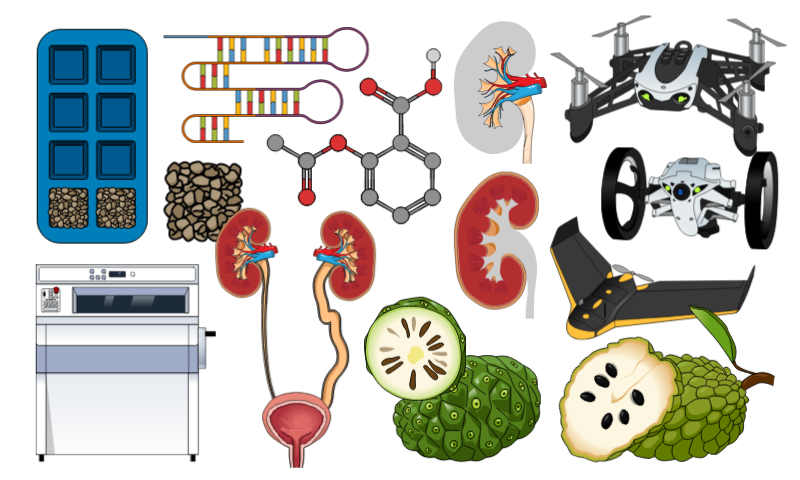
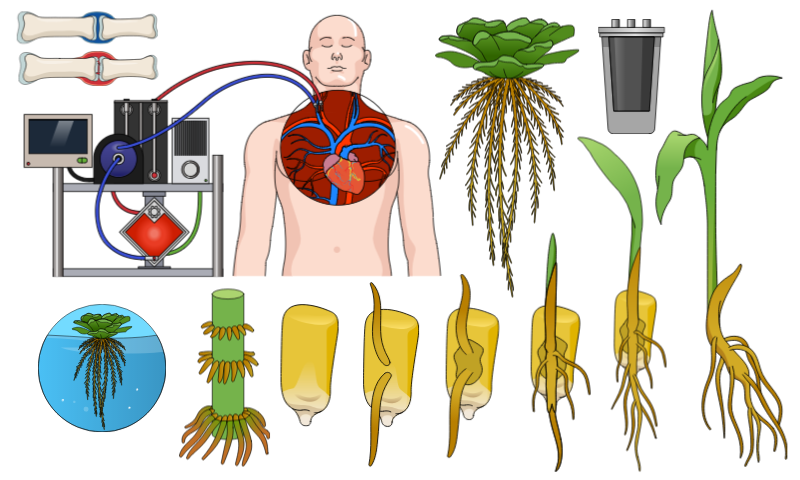
Hello, this week we’ve added amazing new scientific illustrations. All these illustrations are available on […]
Schizophrenia is a chronic and severe mental disorder that affects how a person thinks, feels, […]
Como você sabe, adicionamos novas ilustrações científicas todas as semanas no Mind the Graph. Já […]
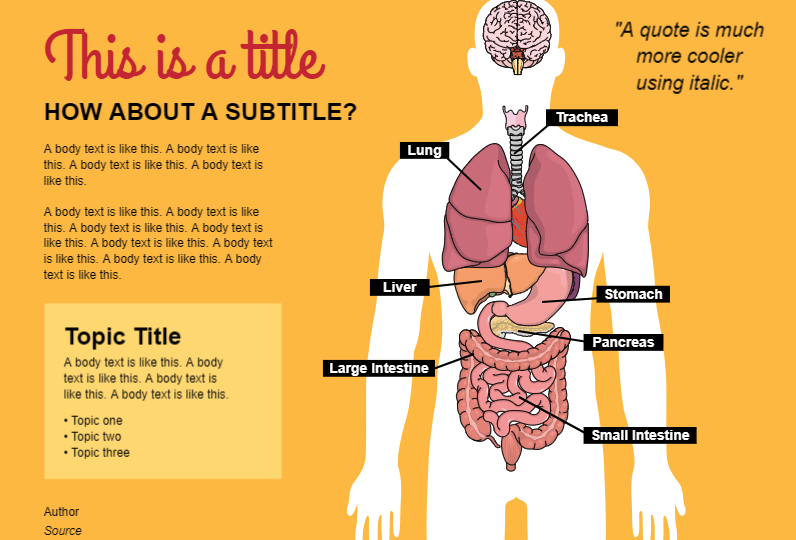
Mind the Graph Templates If you are a user already, you know that the Mind […]
Improve science communication is important to reach more people and fight against misinformation. Illustrations are a […]
Hello! As you know, we add new scientific illustrations every week in Mind the Graph. […]
If you are a teacher or if you present your data in scientific congress you […]
Hello, It’s time to show the new scientific illustrations of the week! Take a look […]
Mind the Graph is an online platform that allows scientists to create graphical abstracts and […]