4 min read
12/17/2021
Mind The Graph Scientific Blog is meant to help scientists learn how to communicate science in an uncomplicated way.
Everything you need to prepare a research paper: how to write, how to choose the topic, how to use illustrations, citations and more!
Ever tried to create a molecular illustration with classic molecular viewers? If the answer is […]
Graphical abstracts and Cell Press If we stop for a second and analyze, graphical abstracts […]
The plant The active component of Andropogon virginicus seems to be capable of reducing complications […]
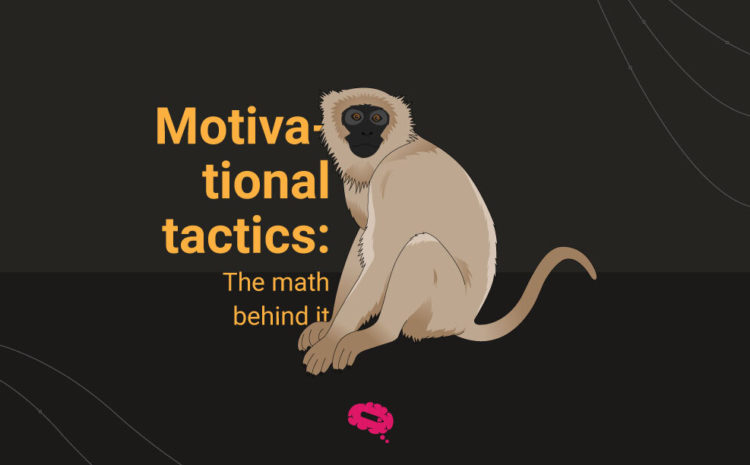
The Reward System An internally motivated strategy controls how big an effort we put forth […]
Nature Special Edition Welcome, everyone! Welcome to this very special edition of Mind the Graph […]
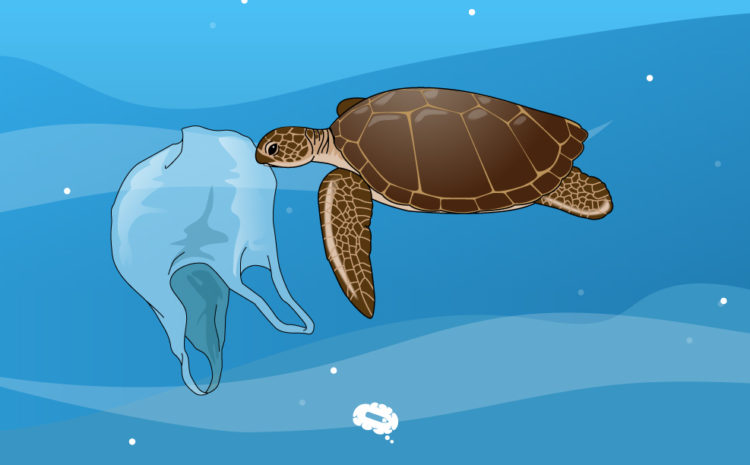
Turtles and plastic A study shows that plastic pollution traps young sea turtles over time. […]
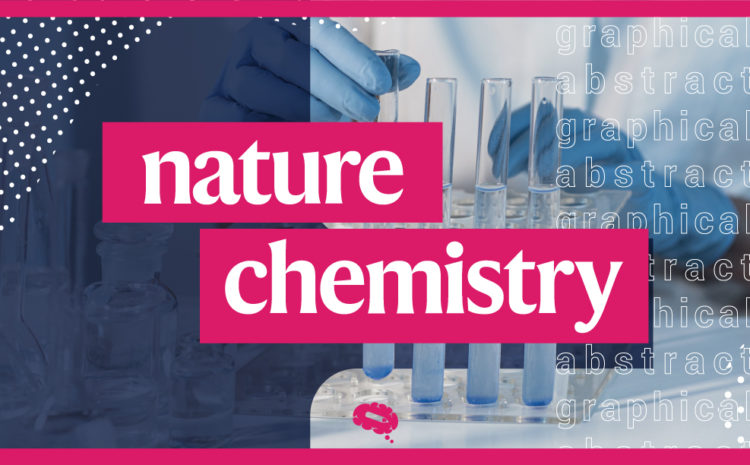
Graphical Abstracts and Nature Chemistry Presenting scientific articles in a new and innovative way to […]
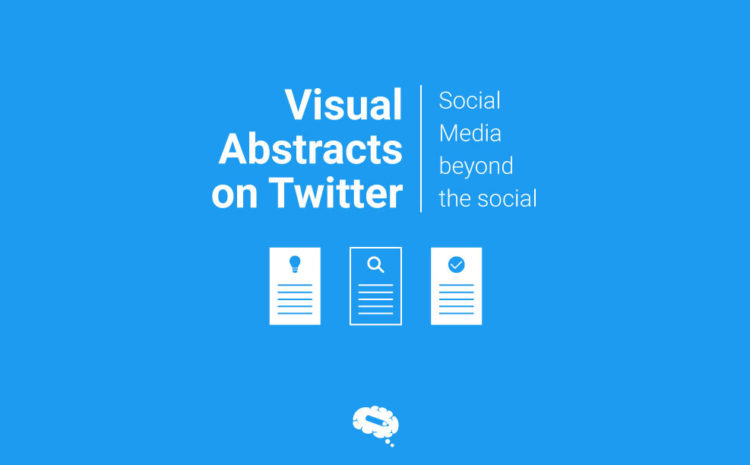
Social media beyond the social In the past few years, due to the strong influence […]
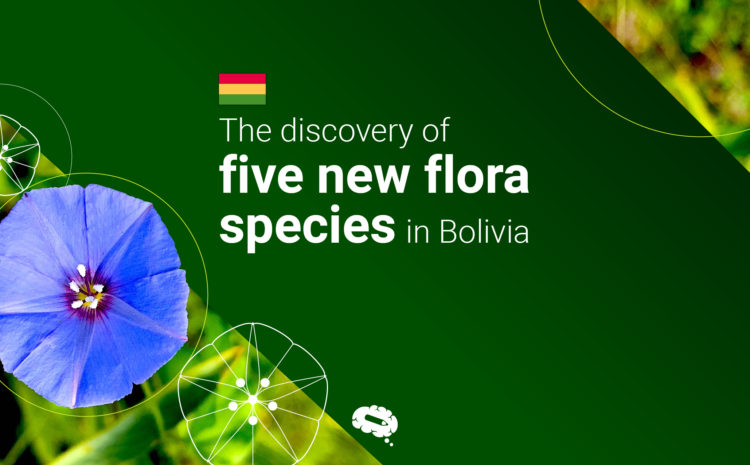
Jacquemontia (Convolvulaceae) new species Researchers discovered five new species of Jacquemontia (Convolvulaceae) in two different […]
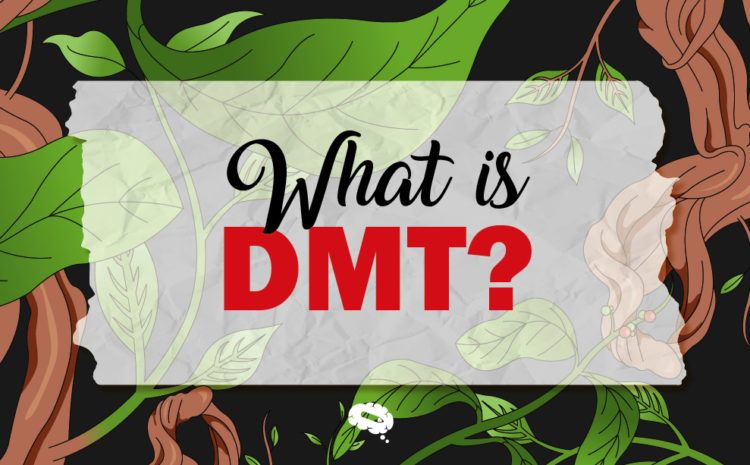
What is DMT? DMT, or N, N-dimethyltryptamine, is a natural substance present in the leaves […]
Scientific illustrations of Prosthesis on Mind the Graph If you need scientific illustrations, here is […]
Infographics in Healthcare How many times did you find yourself reading flyers in the waiting […]