Social media beyond the social
In the past few years, due to the strong influence of social media in disseminating information, scientific journals found themselves in need of creating social media profiles to better communicate with their audience.
Not only scientific journals, but researchers, editors, and institutions are now with accounts on social media too for professional reasons: to better manage the communication with their public, further distribution, and highlight their scientific publications.
Regarding social media presence, it is not an exclusive necessity of scientific journals or scientists. Today, many businesses found themselves (even more after the COVID-19 pandemic) obligated and forced to have an online presence through websites, pages, or social media accounts to increase their sales rate.
Of course that, in a different way, this is also true for the scientific community.
Academic journals and researchers have been using social media platforms such as Twitter, Facebook, and Instagram to stimulate and expand discussions among all people within and out of the scientific community, increasing the reach of their work, plus the reading and citations rates of their papers.
Unfornatunally, just having an account is not enough to reach these goals. Some strategies are needed to increase engagement among readers. And that is when Visual Abstracts come in!
Visual Abstracts
Known as graphical abstracts, information graphics, infographics, science figures, all the different types of visuals communications is a strategy to promote and disseminate research.
Emerging evidence suggests that social media, together with visual abstracts, have the power to influence traditional bibliometrics, such as citations, reads, and alternative ones related to social media, such as likes, engagements, and retweets. Visual abstracts summarize the scientific paper story to the reader visually appealing, attracting them to the full article.
Contrary to common social media posts usually composed of only text, adding a visual abstract can improve performance in terms of shares, likes, and engagements. And a few recent studies are proving that.
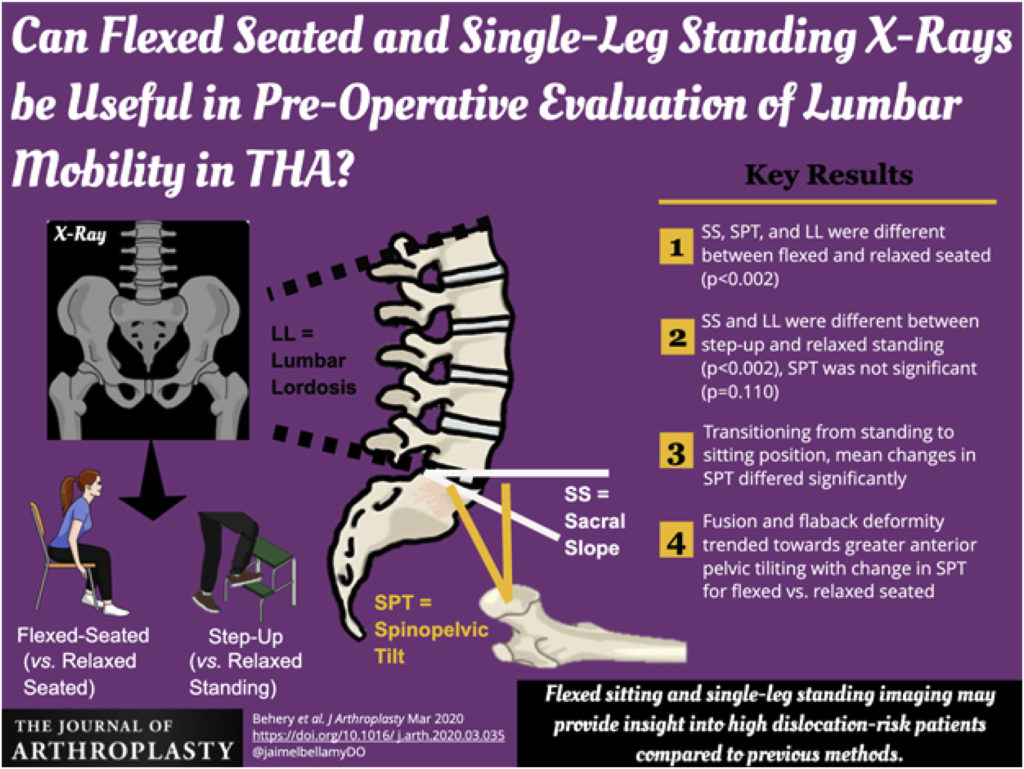
A study published by The Journal of Arthroplasty performed a crossover randomized trial of visual abstracts versus plain-text tweets for disseminating orthopedics research. The study’s main goal was to determine if peer-reviewed journal articles shared on Twitter using graphical abstracts improved user engagement and sharing levels compared with plain-text tweets without an accompanying visual infographic.
The study results show that the dissemination of research tweets with visual abstracts had greater engagement than plain-text tweets. The study shared content of the arthroplasty research area on Twitter and observed that the engagement rate (number of users that visualized the post/number of users who interacted with the post) was higher on the group of tweets with visual abstract.
“Visual abstracts are more visually appealing and attractive to users as they scroll through their feeds”, explains the study, “generating initial intrigue that leads to a more in-depth look.” Moreover, a limited number of characters (at least, on Twitter) may also influence sharing or reposting a graphic instead of only text.
But remember, visual abstracts are not substitutes for the article. They only provide a simple and quick preview of the study, which helps clinicians and researchers find the contents most applicable to what they are more interested in or looking for.
At the end of the study, the authors recommend that “journals use visual abstracts to increase their engagement with users of social media platforms”.
Visual Abstracts on High Impact Journals
We want you to understand how a visual abstract can have multiple forms and styles and present different information. We gather for you a few graphical abstracts / visual abstracts published in high-impact journals.
The following visual abstract is from the previous study mentioned, “A Crossover Randomized Trial of Visual Abstracts Versus Plain-Text Tweets for Disseminating Orthopedics Research”. The study was published in The Journal of Arthroplasty in August 2021. The visual abstract summarizes if flexed seated and single-leg standing x-Rays can be useful in the pre-operative evaluation of lumbar mobility in THA.
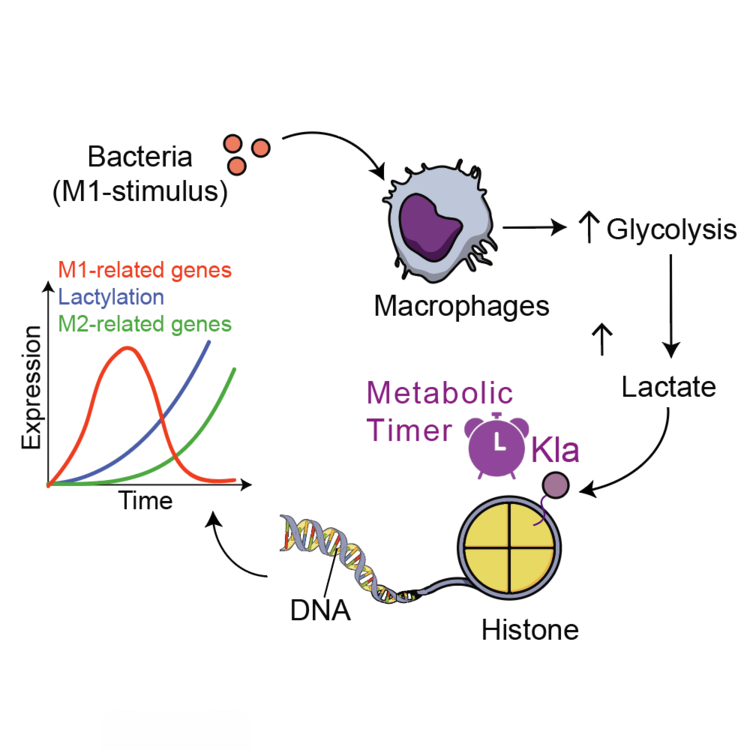
The next graphical abstract, created using Mind the Graph platform, is from a Nature article published in October 2019, named “Metabolic regulation of gene expression by histone lactylation”. The study was accomplished by The Becker Laboratory. Check their website to see more beautiful graphical abstracts created by them.
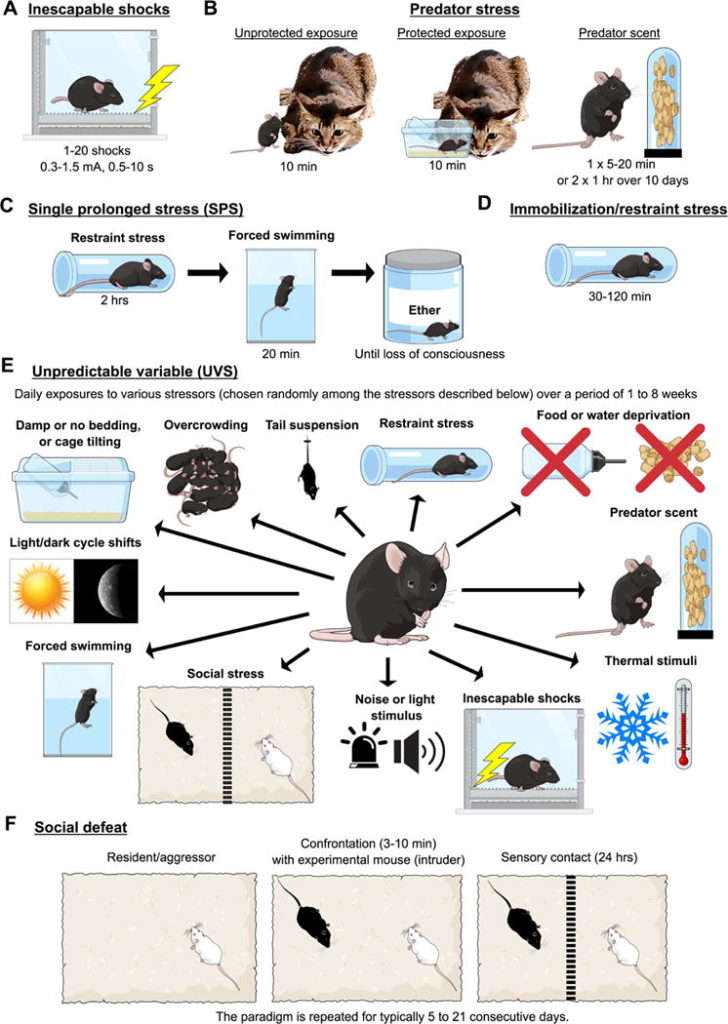
The next graphical abstract was published in the Biological Psychiatry Journal in May 2018. With the title “Current Status of Animal Models of Posttraumatic Stress Disorder: Behavioral and Biological Phenotypes, and Future Challenges in Improving Translation,” the study presents this graphical abstract with an illustrated schema of the several animal models of posttraumatic stress disorder, and it was created using Mind the Graph.
This visual abstract is found in The New England Journal of Medicine, titled “Vadadustat in Anemia and Non–Dialysis-Dependent CKD”. The visual abstract shares information about two randomized, phase 3, open-label noninferiority trials comparing vadadustat with darbepoetin alfa patients with non–dialysis-dependent chronic kidney disease. In this case, the visual abstract shared the findings of the study and the information about the methodology.
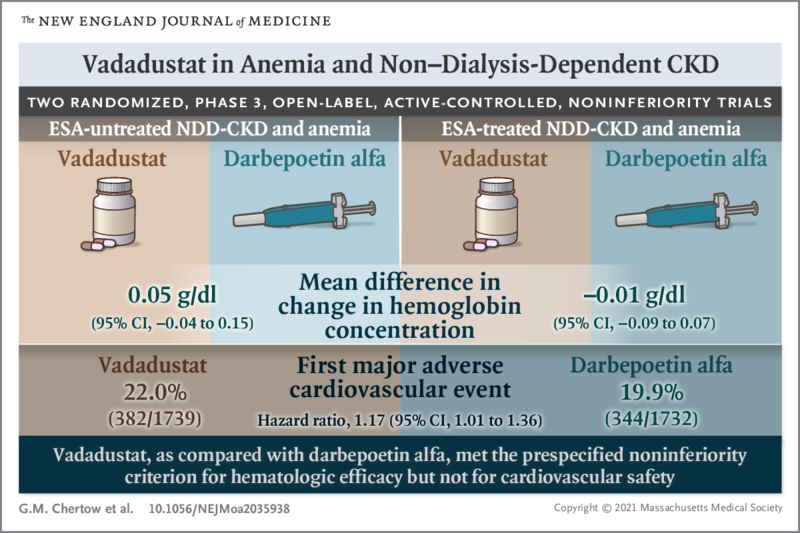
The New England Journal of Medicine has many visual abstracts available for you to check out, the journal using very actively visual abstracts for their articles. Make sure to visit their website and check it out.
Nature and graphical abstracts?
Nature has been using more and more visual abstracts to expand the dissemination of science. Even though not all Nature Portfolio demands a graphical abstract, for Nature Chemistry manuscripts, you can find a Nature Chemistry Preparing your Submission page with the following guidelines for graphical abstracts:
- The graphical abstract may contain chemical structures or images;
- Textual statements should be kept to a minimum;
- Colour graphical abstracts are encouraged and will be published at no additional charge;
- The image must be sized to fit in a rectangle of dimensions 90 mm wide × 50 mm high;
- The graphic should be submitted as a single file using a standard file format and will be published in the table of contents in print and online;
- All graphical abstracts should be submitted with a white background, and imagery should fill the available width whenever possible.For more information, visit the Nature Chemistry / Preparing your Submission page here, and be sure to see also all the figure guidelines for resolution requirements.
For more information, visit the Nature Chemistry / Preparing your Submission page here, and be sure to see also all the figure guidelines for resolution requirements.
Ready to start your visual abstract? Mind the Graph is waiting for you!
Click here to start your creation!


Subscribe to our newsletter
Exclusive high quality content about effective visual
communication in science.