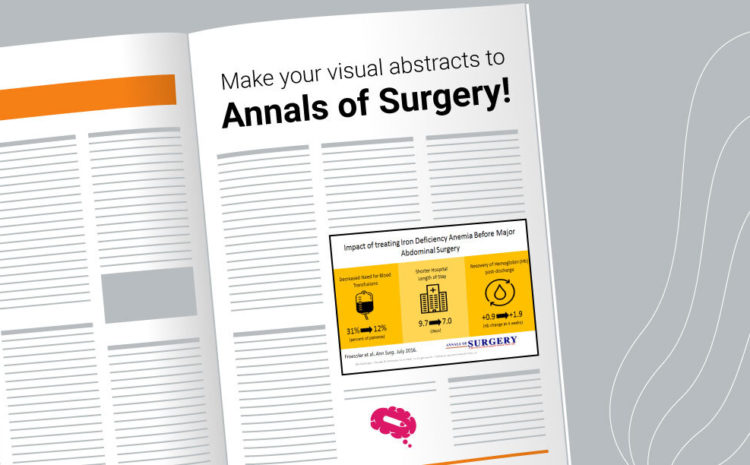
The Annals of Surgery, the world most referenced surgery journal, is now working with visual abstracts to make scientific information more accessible!
Researchers that have already submitted papers to the Annals of Surgery will be able to build visual abstracts about their researches and add to previously published studies.
“As the Creative Director at Annals of Surgery, I have been working on better means to disseminate research. One approach is to visually summarize key points from the article in a “visual abstract.” Some examples can be seen below as well as on Twitter by following the hashtag #VisualAbstract.” Andrew M. Ibrahim
Dr. Ibrahim’s bio is really interesting, linking design and medicine. We loved it, he’s a very inspiring professional! You can see it here as well, where he offers a fellowship on design and health.

Visual abstracts
Creating a visual abstract it’s not that difficult if you have the right resources, like Mind the Graph. However, since most scientists still don’t know how to produce visual information, the journal provided an amazing guide explaining how to create visual abstracts.
In it, there are basic rules about the type of information you should be looking for and putting together to build the visual abstract. Check some below:
Focus on the user experience
Always keep the reader in mind. If you’re planning for social media communication, think about what your audience on Twitter would like to know about that specific scientific research. Have clarity of purpose in mind while designing your visual abstract.
The more complex is the article, the more time you should spend time narrowing the key message that you want to deliver. Simplify to establish a focus. This way is easier for your audience to get the “take-home message” of what you wanna communicate.
Rapid Prototyping
There are infinite ways to visually display research. We recommend that you try first on paper or with very brief scratches on your preferred online tool. I like to create a mind map even before starting so that the content is roughly organized even before you start. Content organization is already the first start and the most difficult part that is often overlooked!).
As Dr. Ibrahim’s says “Your 1st, 2nd or 10th visual abstract won’t be your best one. You will improve significantly by rapidly trying new formats and seeing what works! Iterative Improvement. Rather than ask, “Is it perfect?”.
If you are still in doubt, as a colleague to read the visual abstract and tell you what the research is about. It would be an insightful conversation ad what we call an “interactive process” of visual design. You will significantly improve by soliciting feedback and studying other designs as well.
Thoughtful Restraint
Prioritize the key message over completeness. You don’t need to feed the whole information at once, plan for step-by-step instruction for your reader. Just the key message should be in the visual abstract, keep the rest for the other elements of the research paper, like the abstract section and the paper itself.
The visual abstract should provide context to your reader, but if not well designed it may also distract from the key message. In the case of visual abstracts, more is not always better.
Relevant Creativity
Always balance your design creativity with thoughtful restraint and clarity of purpose. Don’t need to “appear creative” by using many resources and fancy elements, like 3D images where you don’t need it. Focus on the information you wanna pass on your visual abstract. Experimenting “just to be different” isn’t always effective. Remember, the illustrations are not the message, they are the media. The same thing for the use of colors, be insightful, as colors are also information.
These principles are based on the design contributions on how to craft an effective visual message. As Dr. Ibrahim suggests “You will want to embrace some principles of design when creating your visual abstract”. You can see some of these principles in action here in this Mind the Graph’s Experience video showing the design of a visual abstract:
Making it visual
We loved this session of the guide for visual abstracts by Dr. Ibrahim, according to him here is “where most people get stuck”. That’s true, layouting may be difficult for those not initiated, but we try to inspire you with a few templates.
Finding Images may be one alleged difficulty. There are a number of image banks on the internet, some of which are free to use. If you do visual presentations often enough, you may consider purchasing a subscription to
access higher-end icons (e.g. Shutterstock, Getty Images, Noun Project) or use a complete tool dedicated to scientists, like Mind the Graph. In some cases, you may need to create the icon yourself or collaborate with a graphic designer, and we may help you there as well. The service is included in the subscription.
Also, make sure that your image allows copyrights for publication. That’s key! Just because an image is on the internet, does not mean it is free to use. You MUST ensure that you have copyright permission to use the images to avoid copyright issues with your visual abstract.
According to Dr. Ibrahim “This point cannot be overemphasized enough. To avoid this problem, either uses the copyright filter during your image search or subscribe to an icon image bank.” I agree 100% and that’s why we created Mind the Graph with a Creative Commons license that acknowledges the authorship of our clients. We consider that the illustrations offered through the platform are our assets, which we share with the users, but whatever they created it’s theirs! Including the possibility to transfer to publishers like LWW, Elsevier, Springer Nature, and anyone that allows graphical abstracts and visual abstracts.
That’s how we recognize the scientists as creative individuals that author images in Mind the Graph! We want to foster creativity and empower individuals. We like to say that “we turn scientists into designers” and all our users have to do is to keep the watermark and cite Mind the Graph in the papers, like many authors already did – see examples of published papers in Google Scholar.
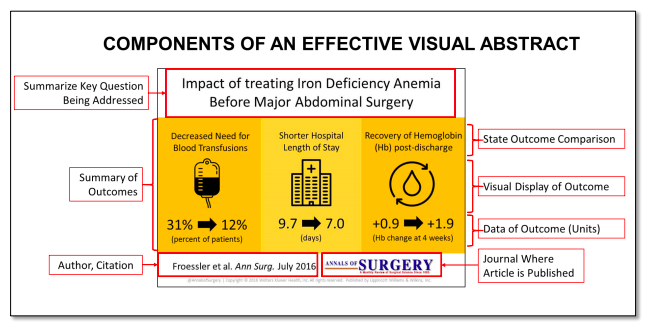
To make it short – Key components of the visual abstract in Annals of Surgery
- Summarize the Key Question Being Addressed: this usually comes from the title of the article or a heading of key figure. Keep it short and clear.
- Summary of Outcomes: you will need to spend time thinking about outcomes you want to present.
- Author, Citation: always include at least the first author’s name and year of publication.
- State Outcome Comparison: a short phrase that clearly states the outcome with the respect to groups being compared.
- Visual Display of Outcome: You will want a visual that reflects the outcome you’re describing.
- Data of Outcome (Units): In addition to stating the outcome, you will want to give the numeric representation. Be sure to include the units.
- Name of the Journal: here we ate talking about the Visual Abstracts of the Annals of Surgery, but many other journals accept this elements, or insightful science figures as well.
Scientific illustrations that portray faithfully real study objects are very difficult to find. Most time, we need help from a designer to get the illustrations we need. And even when we do find them, we must worry about their “visual style” and copyright issues.
If this is one of your biggest struggles when trying to build a visual abstract, you can just use the illustrations available at Mind the Graph platform!
Indeed, journals are getting aware of the importance of visual communication in science and it is very important to see big journals like the Annals of Surgery promoting it.
And remember, you’ll always have Mind the Graph to inspire you with templates or help with designing your visual abstract! Try it for free!


Subscribe to our newsletter
Exclusive high quality content about effective visual
communication in science.