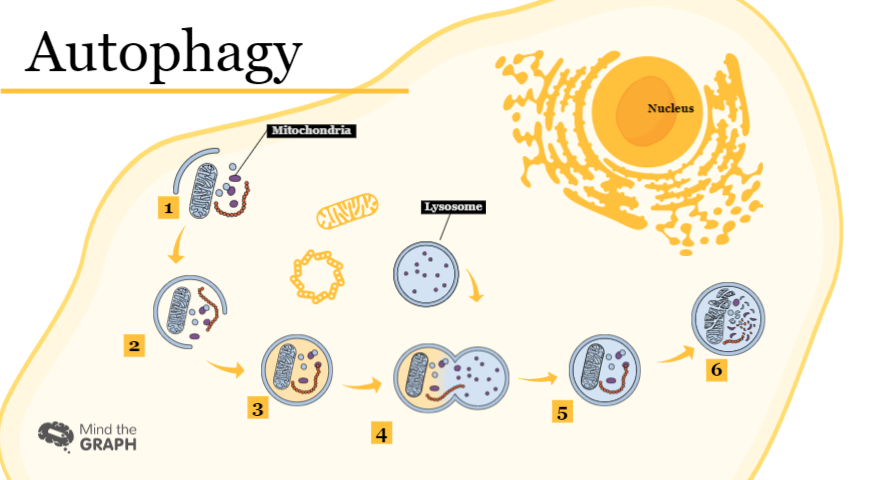
Creating a graphical abstract, infographic or presentation that is visually attractive and scientifically accurate isn’t an easy task. We have a library with thousands of scientific illustrations, mostly of life science to help scientists improve their communication.
En vakker illustrasjon løser imidlertid ikke alt. Den må være godt plassert og matche de andre elementene i kreasjonen din.
I tillegg til hovedillustrasjonene kan du derfor finne flere bakgrunner, former, ikoner og sekundære illustrasjoner på plattformen vår. Du kan bruke kreativiteten din til å prøve ulike kombinasjoner og velge den beste.
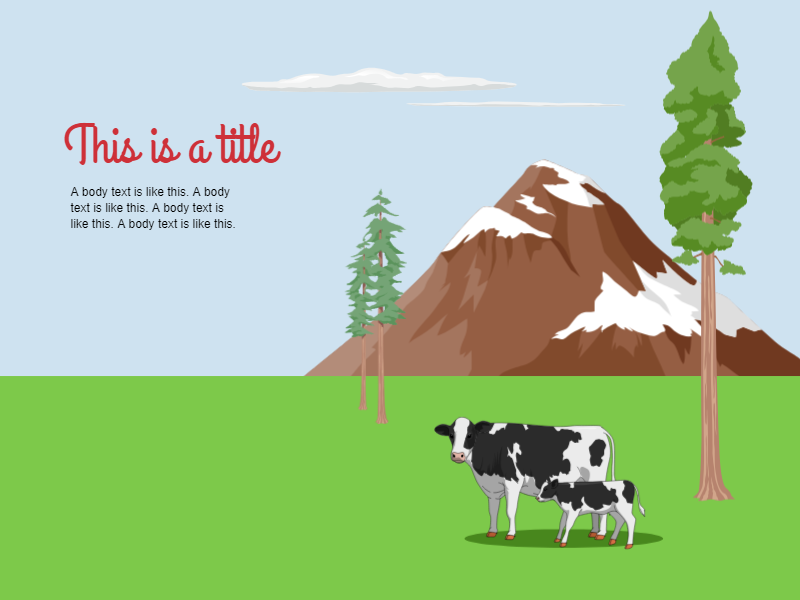
We’ve made a tutorial to help you find the best way to combine backgrounds, shapes and illustrations, to create a landscape. We chose a nature theme, but you can use the tips to create a graphical abstract or infographic about your research field.
Se opplæringsvideoen og la fantasien få fritt spillerom:
Vi har en YouTube-kanal with tutorials, tips and graphical abstract examples. Subscribe to watch new videos every week.
Hvis du ikke finner den illustrasjonen du trenger, er det bare å skrive til contact@mindthegraph.com og be om en ny. Vi lager illustrasjoner på forespørsel to our subscribers. After your request, it takes a few days to your illustration to be ready. You can see all the benefits of being a Mind the Graph subscriber her

Abonner på nyhetsbrevet vårt
Eksklusivt innhold av høy kvalitet om effektiv visuell
kommunikasjon innen vitenskap.


