2 min. skaityti
10/24/2018
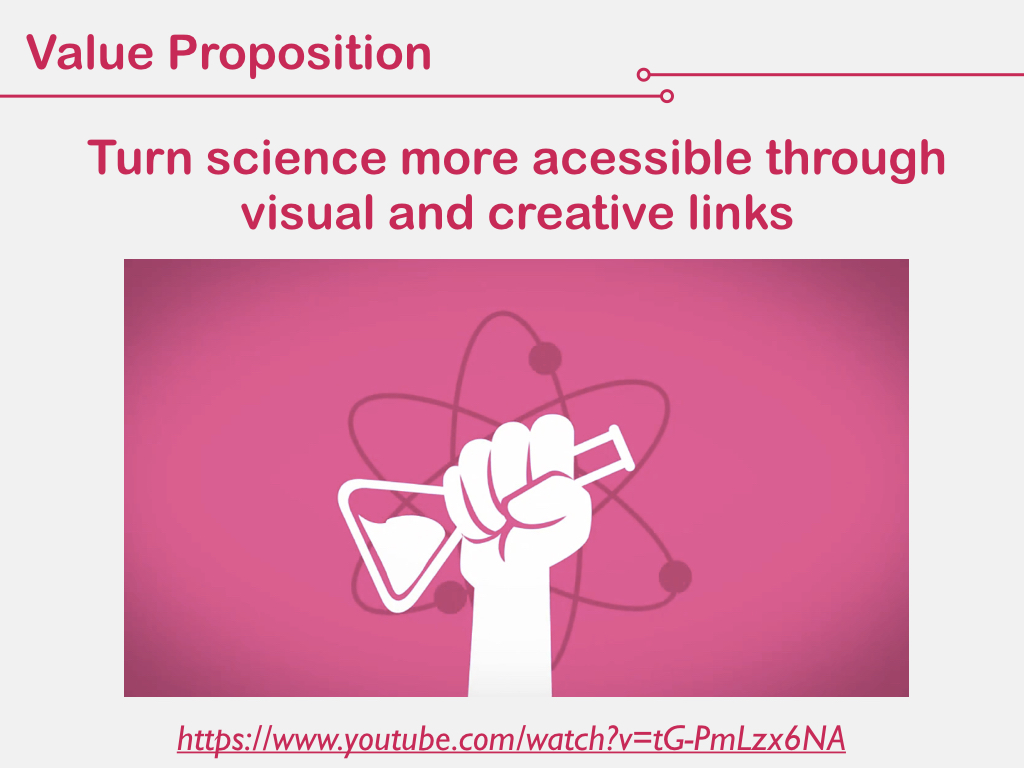
"Mind The Graph" mokslinis tinklaraštis skirtas padėti mokslininkams išmokti nesudėtingai perteikti informaciją apie mokslą.
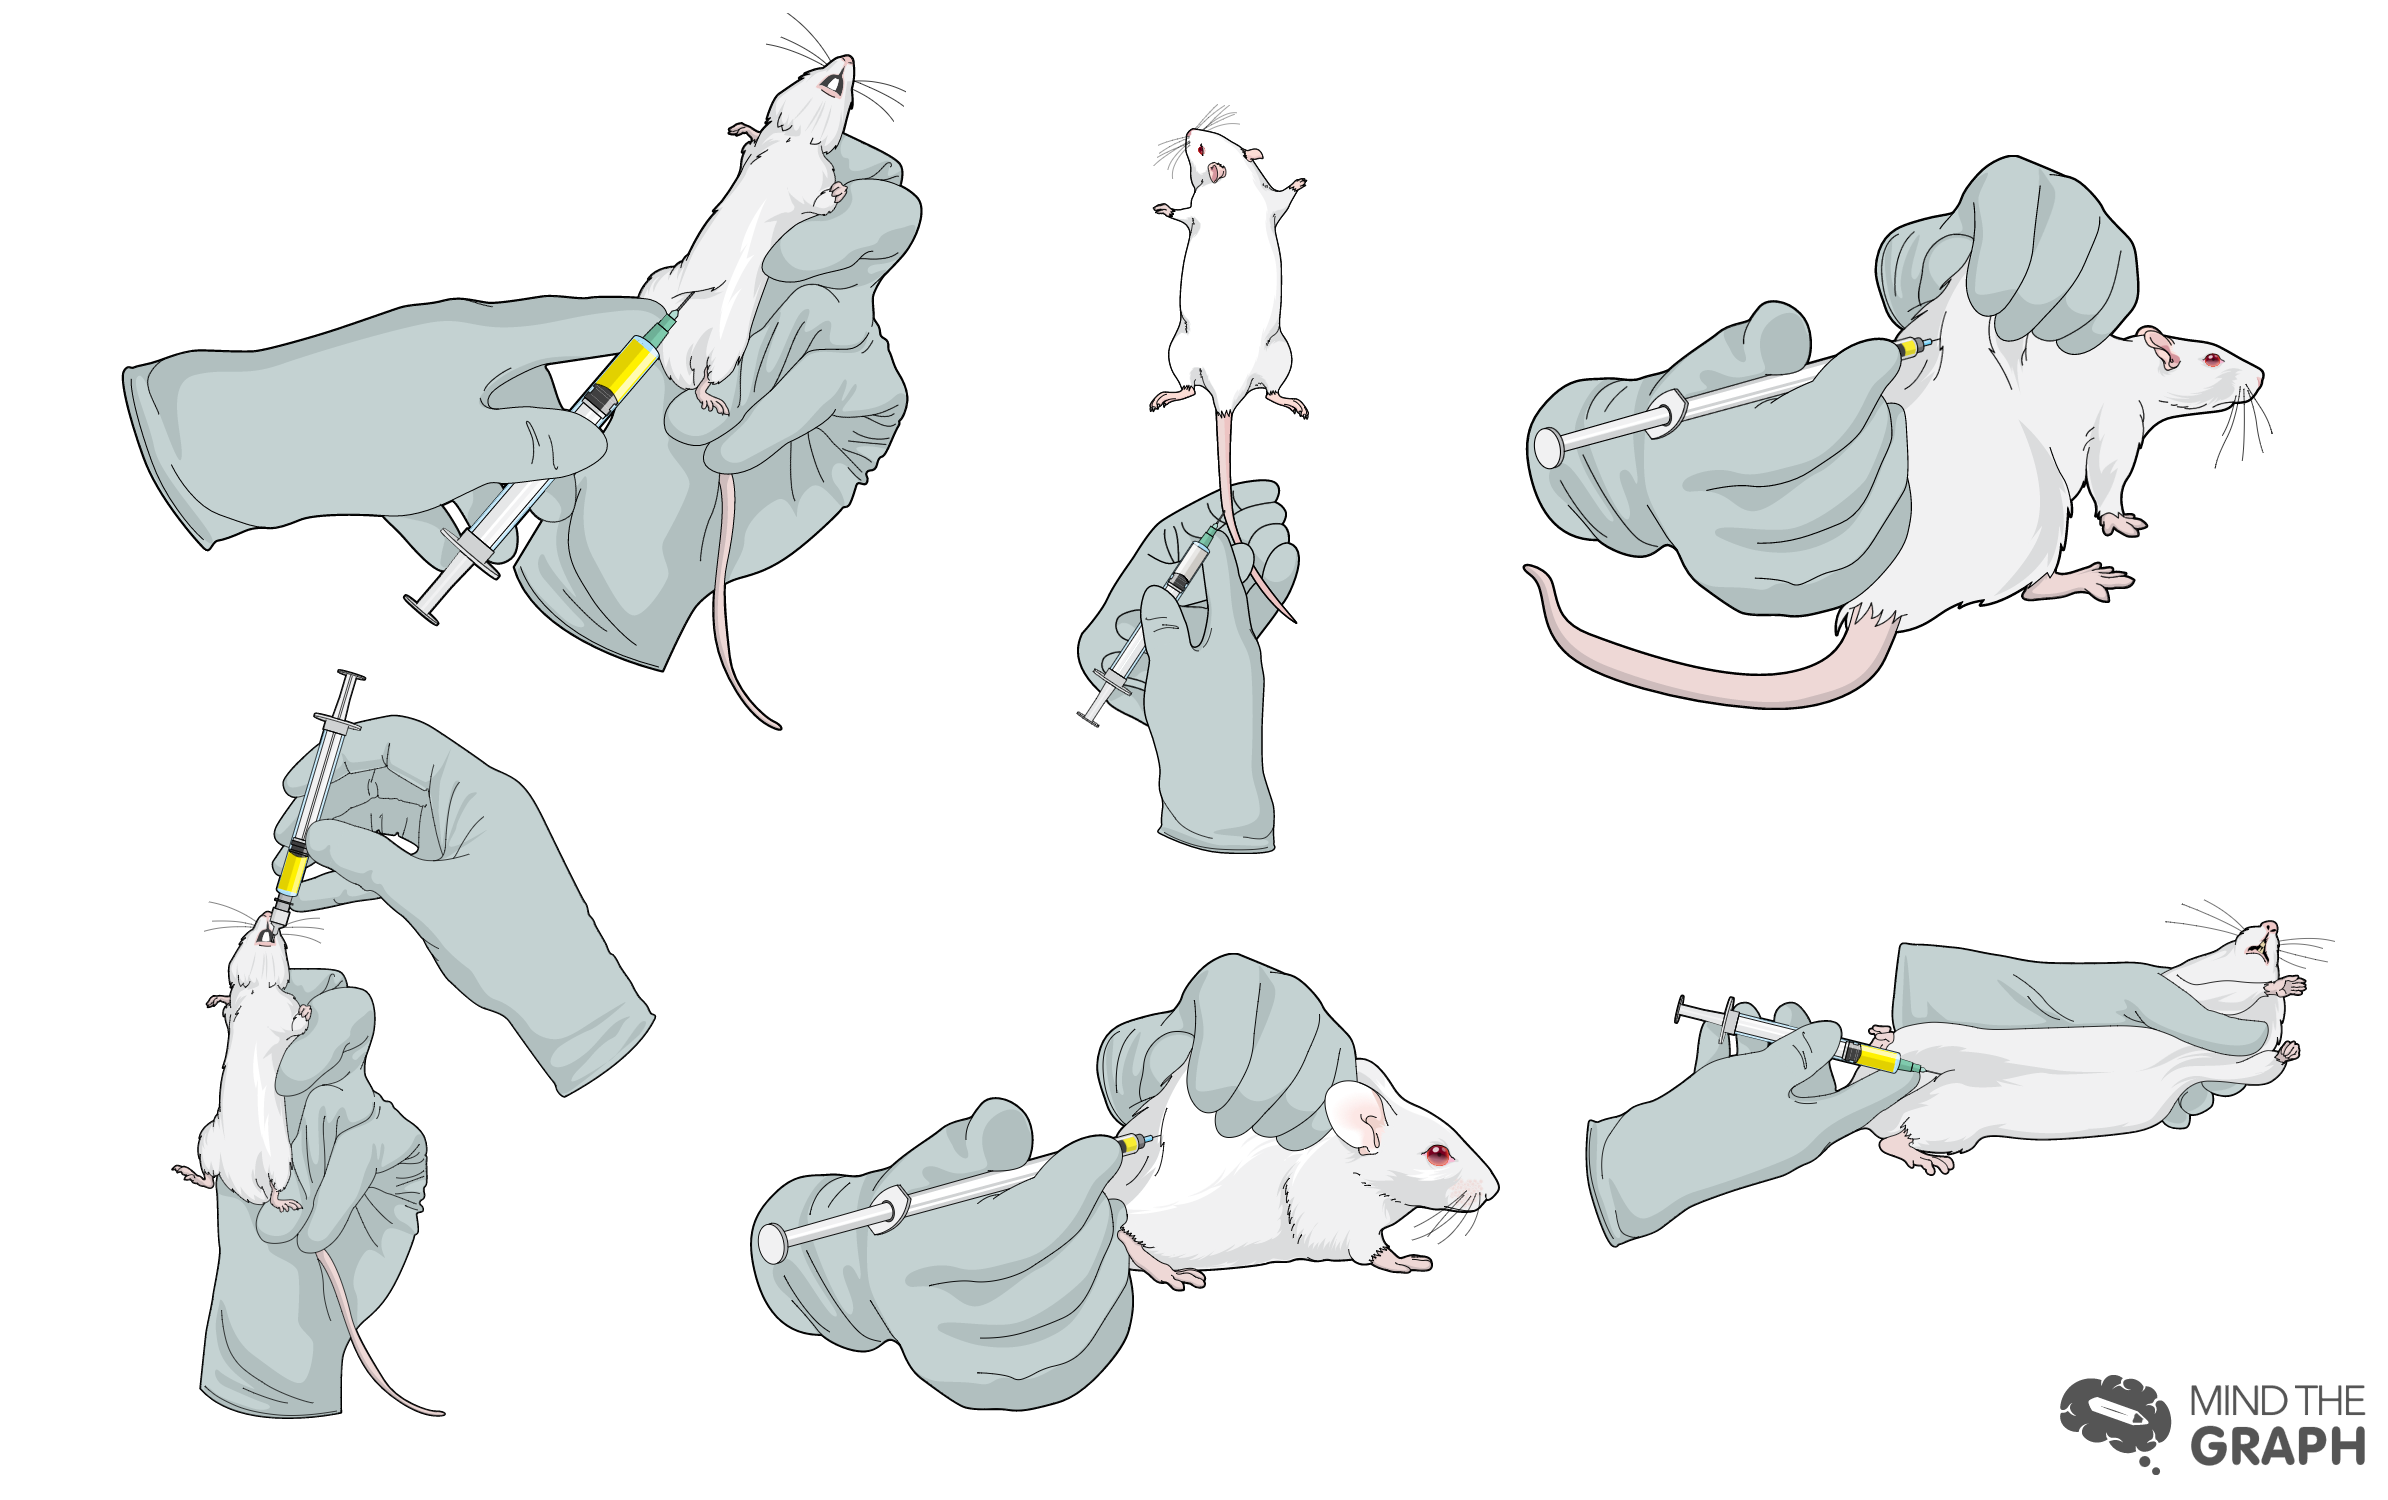
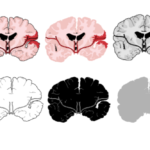
Kaip suteikti daugiau galimybių atlikti mokslinius tyrimus gamtos mokslų srityje naudojant grafines santraukas? Nelengva sukurti tikslius ir gražius ląstelių signalizavimo kelių vaizdus. Tačiau Kaip jau rašiau apie tai, kad dauguma "Cell Press" žurnalų prašo pateikti grafinę santrauką ir kad tai gali būti kliūtis, jei esate mokslininkas, bet ne dizaineris. [...]
Iliustracijos ir infografikos yra puikios priemonės duomenims parodyti ir kalbėti kontroversiškomis temomis, kaip [...]
Vaikai apskritai yra smalsūs ir turi daugybę klausimų. Būtent tokie turėtų būti mokslininkai. Todėl [...]
Kartais gaunu mokslininkų, inžinierių, mokytojų ir kitų specialistų laiškų, kuriuose rašoma: Aš mėgstu [...]
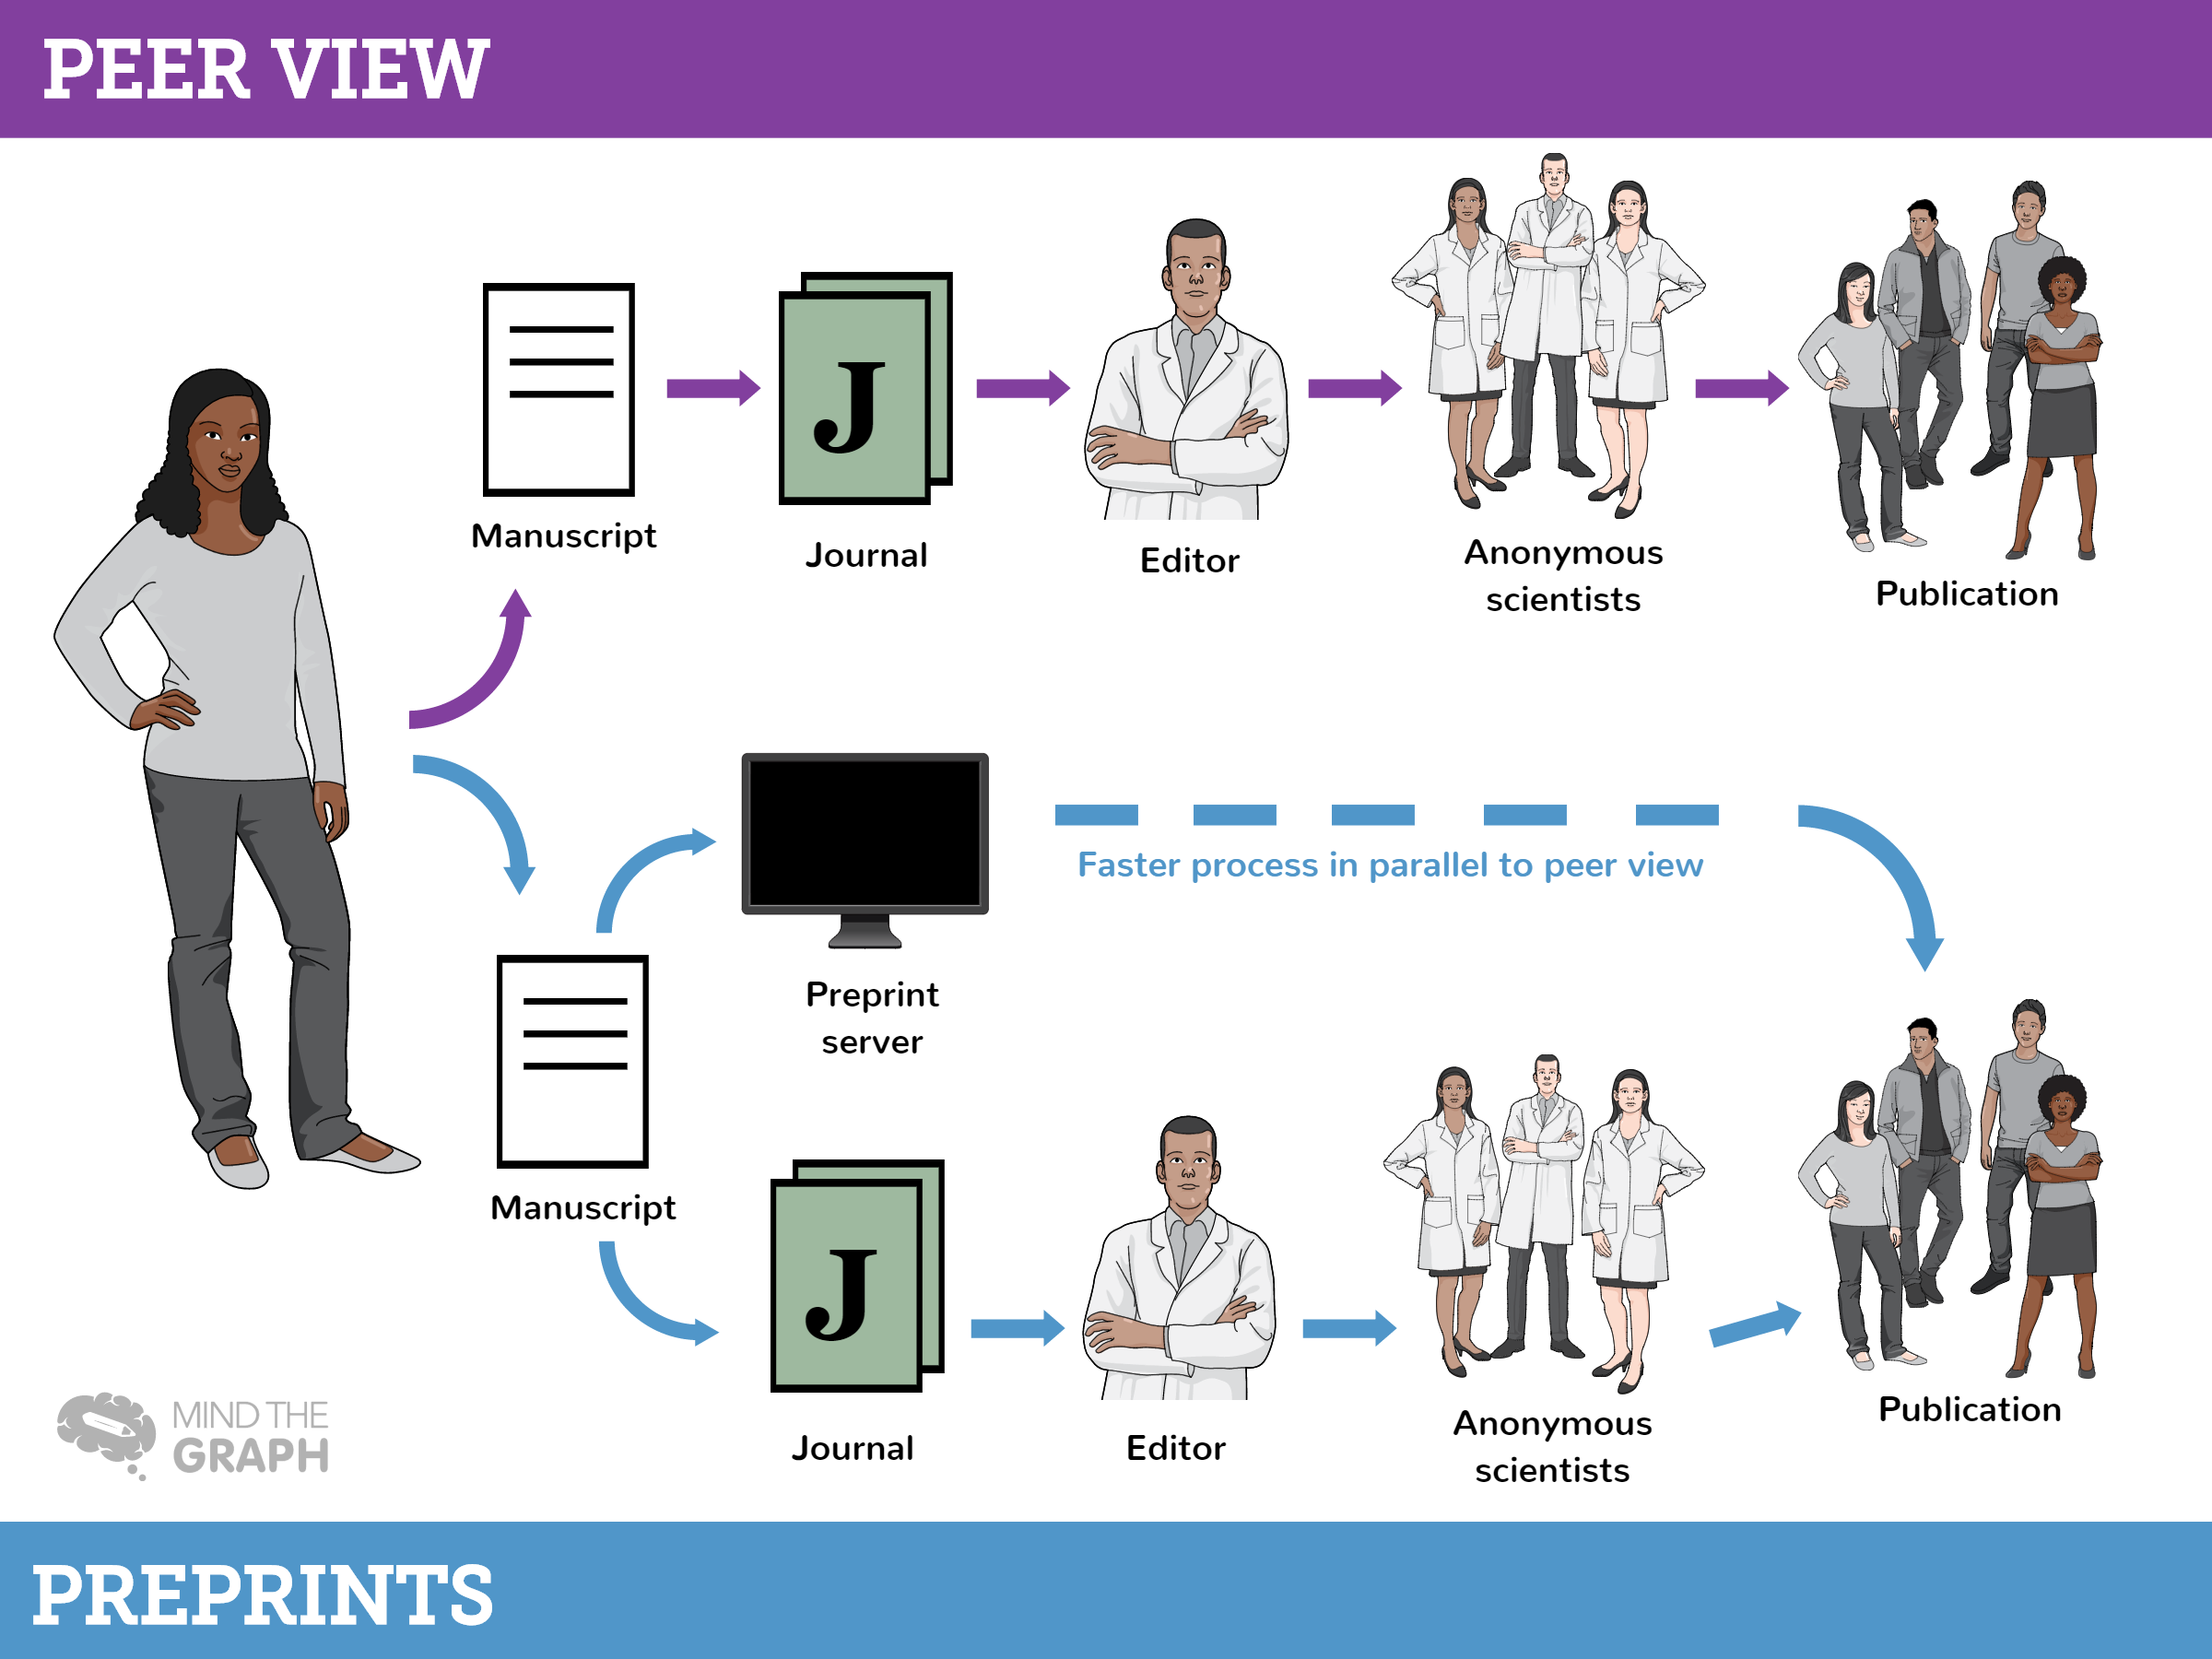
Mokslinė leidyba. Tik mokslininkas gali suprasti, koks dviprasmiškas jausmas apima išgirdus šiuos žodžius. Kai [...]
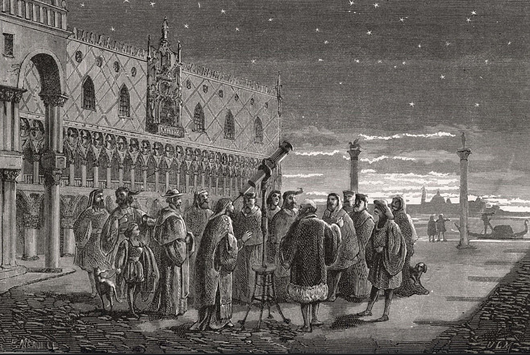
Mokslinė komunikacija ne visada skirta publikuoti žurnaluose. Nuo pat mokslo pradžios [...]
Mūsų didelei nuostabai, Mind the Graph neseniai buvo įtraukta į pranešimą apie prasmingas skaitmeninio prekės ženklo kūrimo strategijas.
Kasdien esame perkrauti įvairiausių formatų informacija. Dar niekada nebuvo taip lengva [...]
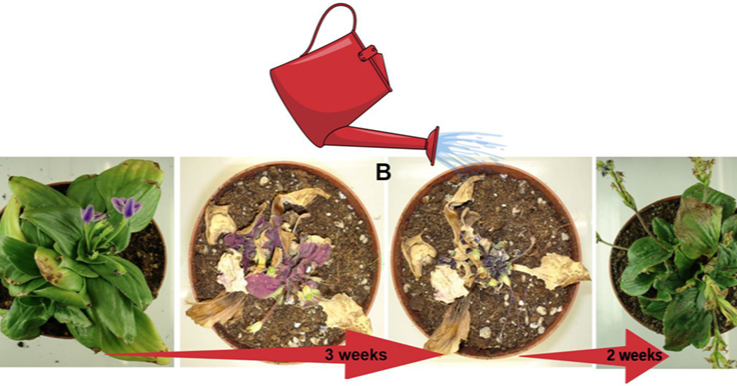
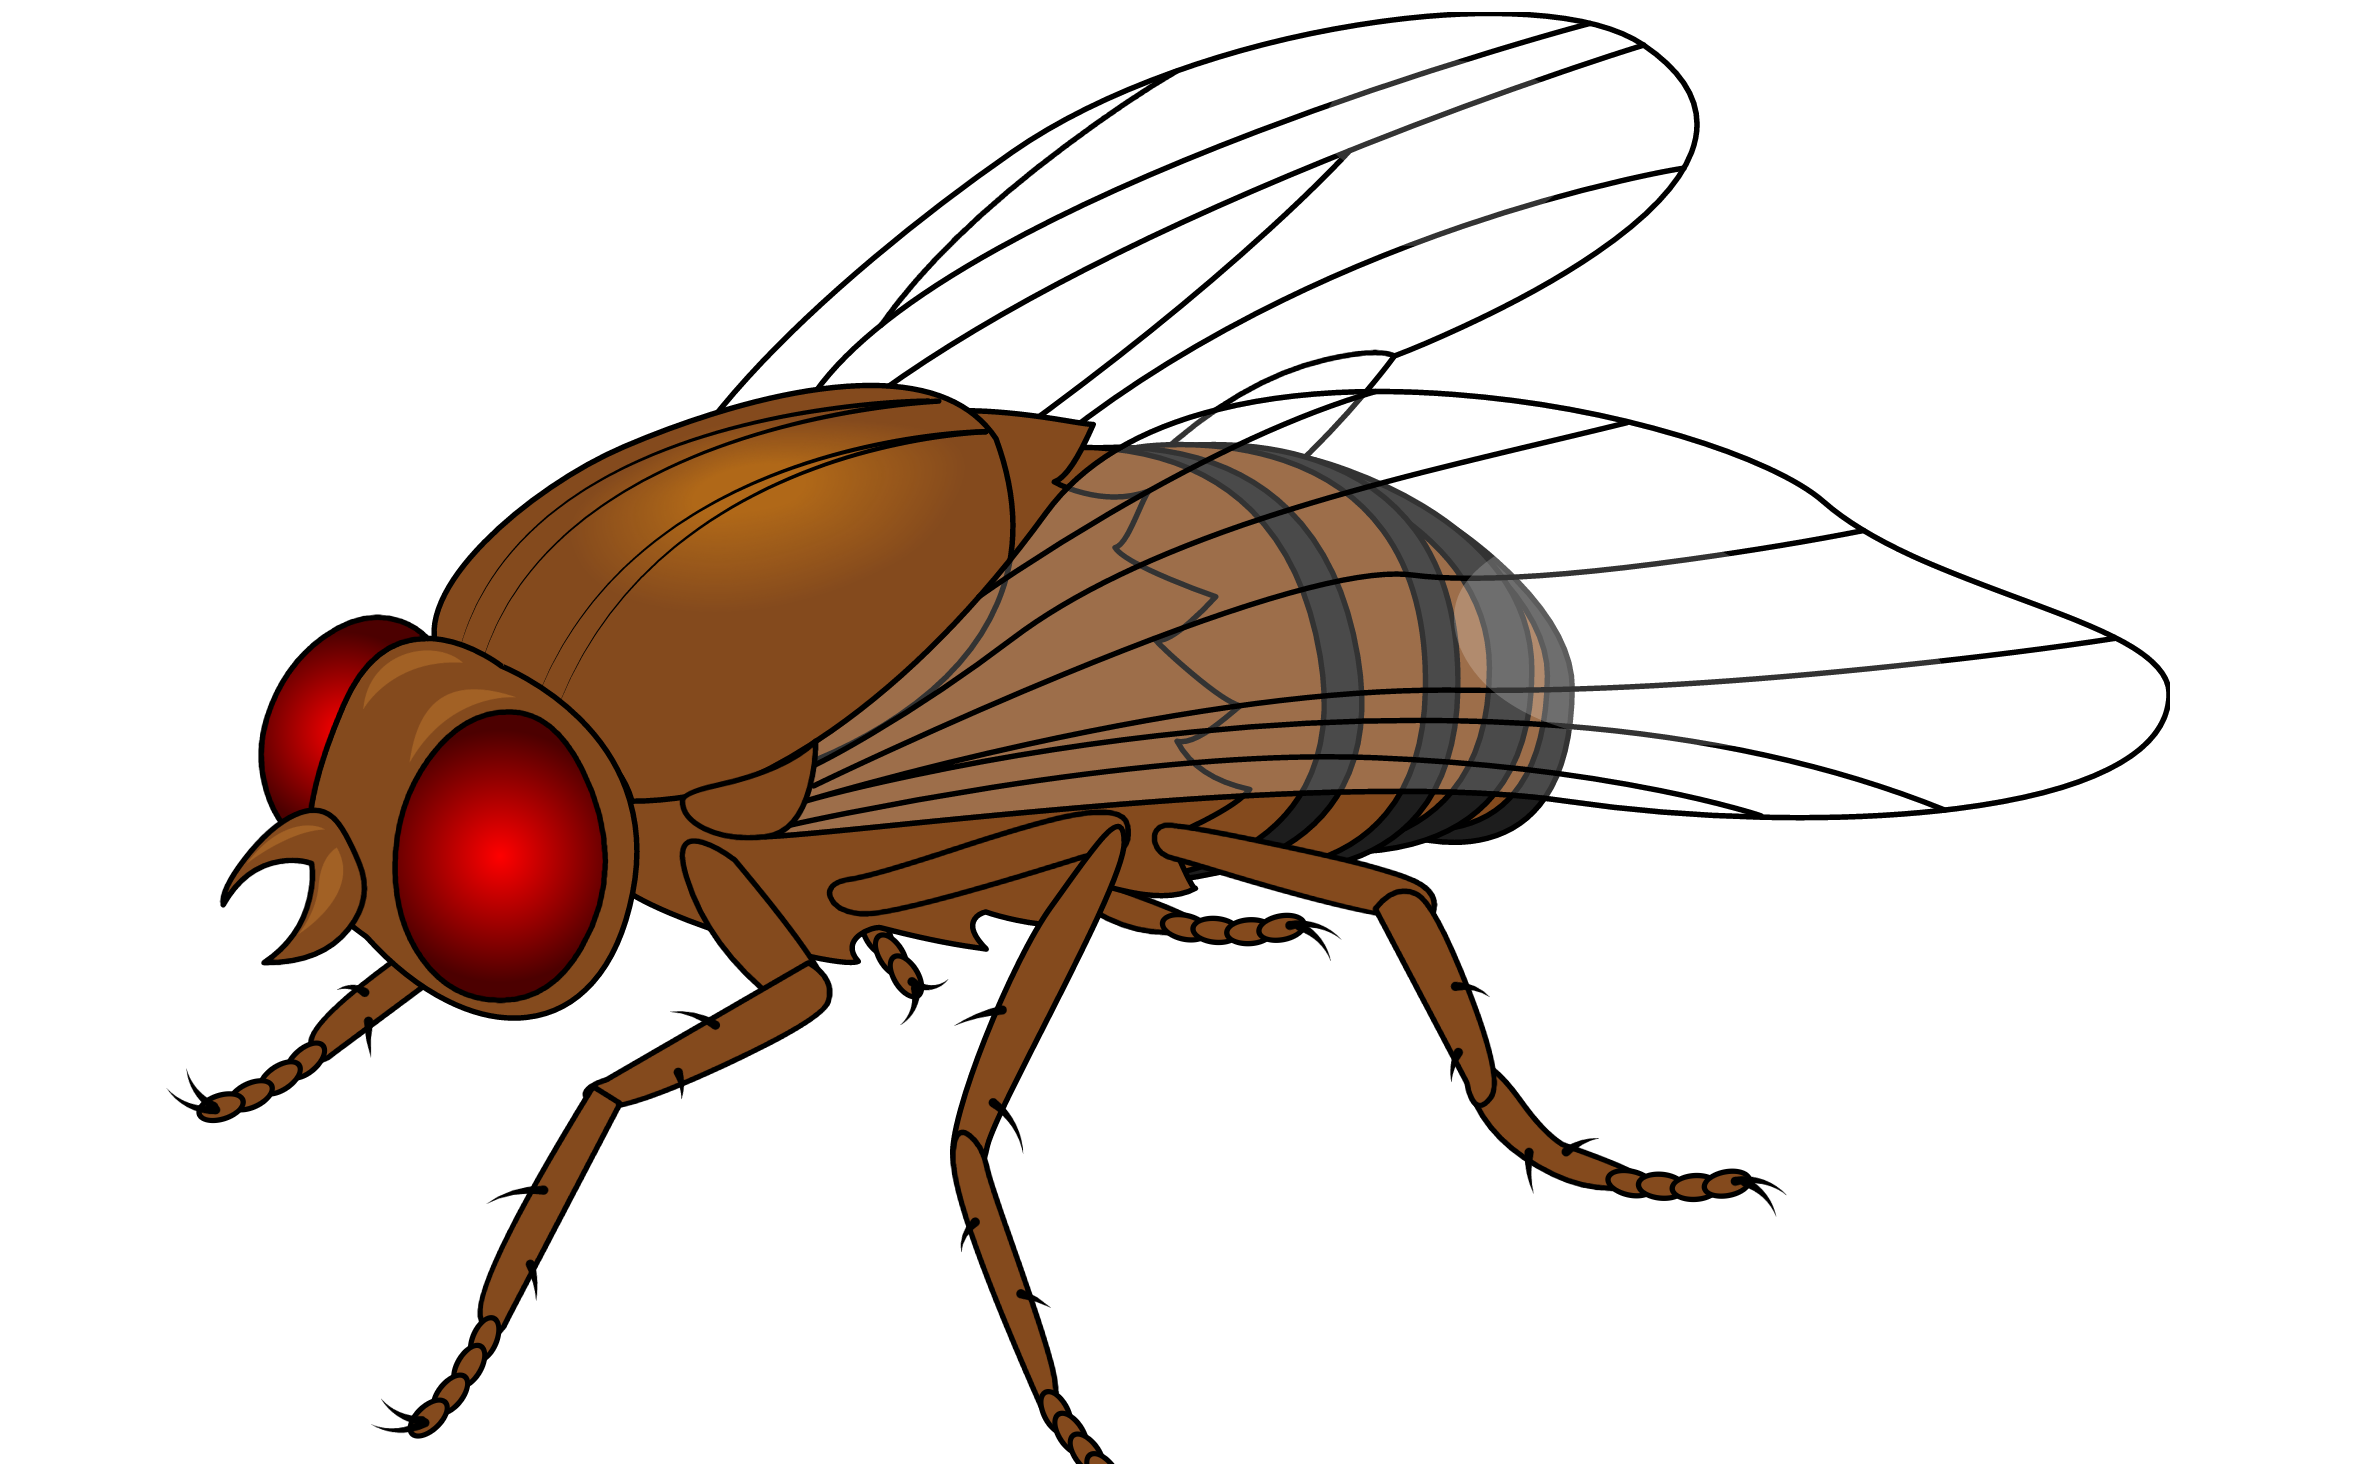
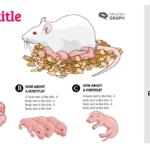
Drosophila melanogaster, arba vaisinės muselės, yra vienas svarbiausių medicinos ir [...]
Kas būtų, jei galėtumėte transliuoti savo tyrimus milijonams žmonių ir padaryti savo darbą [...]
Mokslinio straipsnio formatas buvo revoliucija moksle. Iki jo mokslinė komunikacija vyko [...]
Paskelbti straipsnį, kurio niekas niekada neskaitys, nėra smagu. Vietoj to, [...]
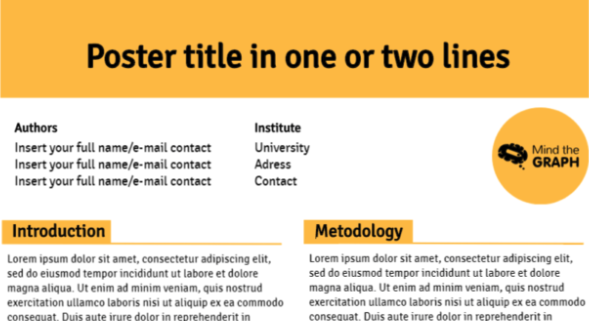
Mokslinio plakato pristatymas yra įprastas būdas pranešti apie mokslinius tyrimus. Tai [...]