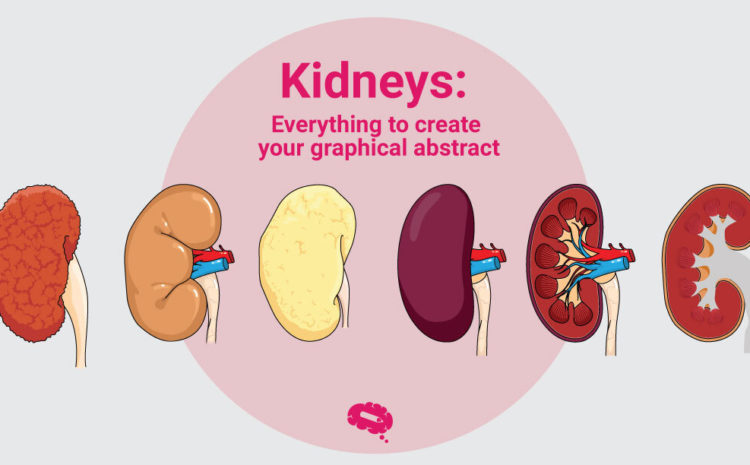
Increasingly, journals are asking for a graphical abstract to submit a paper. But why is this becoming so important?
This happens, because graphical abstracts are a way of communicating with high understanding, accessibility and are remarkable for a research, being in addition to a summary, a way to remember that research itself.
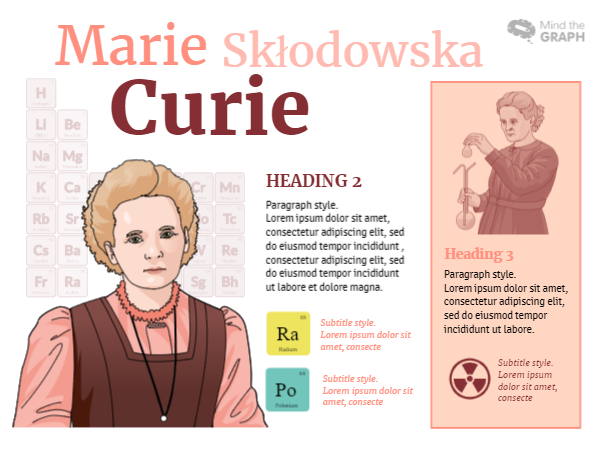
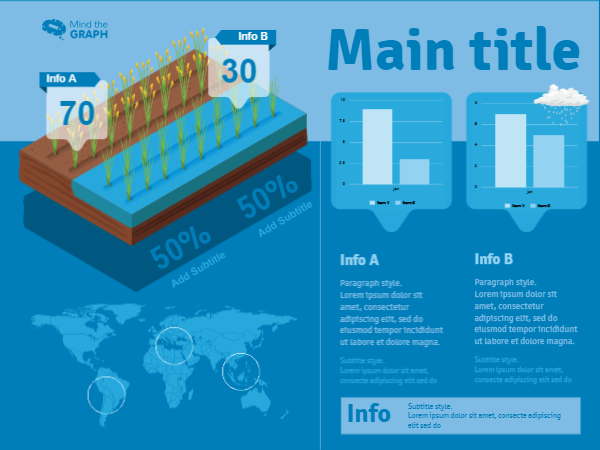
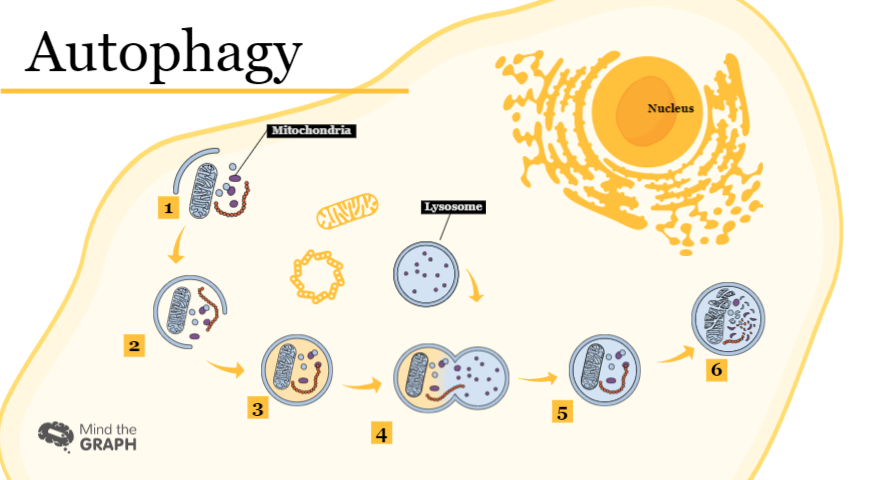
In other words, today, graphic abstracts are indispensable for scientists and their publications. And these graphics can be done in a variety of ways. Here are some examples:
Here, on Mind the Graph, we have a lot of templates that you can use for your publication. But you can create your own graphical abstract in our platform. So, we have separated 5 tips to help you on this moment:
ORGANIZATION
Organize the information you want to include. It won’t fit all your research, remember it’s a summary! So put the essentials and the objectives of your research.
SHAPES
Find the way that makes the most sense for your search. When we talk about graphical abstract, we can work with graphics, illustrations, poster … Many ways, so it is important to find out what is the best form for your paper.
SPACE
There is no point in wanting to put all the written research and not all the necessary images! Remember, organize the information and build your graphical abstract with spaces that facilitate reading.
COLORS
Don’t mix it up! Make the colors according to your theme, but be careful not to get too strong or too mixed. This also hinders the understanding of the information.
YOUR RESEARCH
Without fears! The most important thing to remember when building your graphical abstract is that the research is yours! In other words, nobody knows more about it than you do!
With these tips, we know that you can achieve good results and increase the chances of acceptance in many journals!
And if you want help, you can count on us!

Subscribe to our newsletter
Exclusive high quality content about effective visual
communication in science.

