
Whether in research papers or any other type of document, tables are intended to contain quantitative information. Therefore, it is crucial that tables come along with legends to give the proper context to your audience.
This logic can be applied to figures as well. But it is important to highlight that there are peculiarities between each of them.
In this article, you will learn about figure and table legend definition, their differences, and also get useful tips on how to present them according to your chosen journal’s guidelines.
What is a table legend and why is it important?
As well as figures, tables are visual resources mostly used to illustrate complex subjects and also present data you collect along the research phase.
Also known as “table title”, a table legend is a complement to your table’s content. Its main purpose is to support the table’s information so your readers get the right conclusion from your research. Likewise, it is great to help them interpret the meaning of the underlying results if there are any.
The same applies to figure legends. But there are certain differences between them that you must consider.
Talking about figures, do not forget to use Mind the Graph.
After the research itself, the visuals are the most important asset in your research paper. They are responsible for attracting readers, including the ones that do not exactly have a science background.
Start creating infographics with Mind the Graph and use the power of visuals to your advantage.
Differences between figure and table legend
Assuming that a figure can be interpreted in many ways, a figure legend needs to contain more details, and that already makes them larger than table legends in general. Another point is that they can be placed in a single paragraph, regardless if it is above or below the figure. That might vary according to the journal’s guidelines, so stay alert to all requirements.
On the other hand, table legends are quite short and they must come above the table.
If you need to include more information, use the table footnote!
The table footnote is placed right after the table and can be used to define abbreviated terms, indicate the meaning of superscript symbols (e.g., * to indicate P<0.05), and provide the reader with any other note that helps the understanding.
5 Tips on how to use tables and table legends in research papers
1. Journals do not want lists of numbers in the texts followed by a table containing the same numbers. Keep that in mind!
2. If you create a table that is quite short (only two or 3 rows and columns), consider summarizing the information in a sentence or two instead of using a table, because, in this case, a table legend will not be needed.
3. All tables used to illustrate your research must be cited in the text.
4. Number your tables (and also the figures) in the order that they appear in the text.
5. Consult the journal guidelines before submitting your research paper to raise its relevance inside the publication.
Here’s an example of a research paper’s table and table legend:
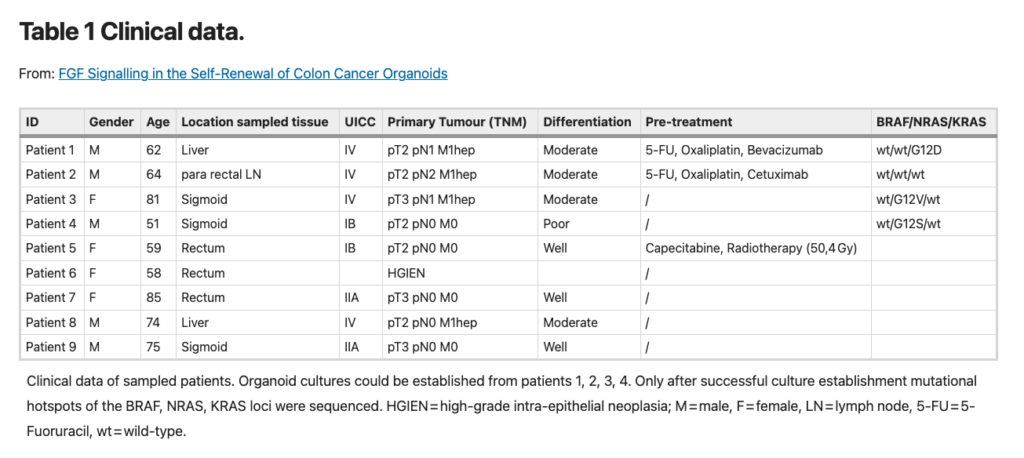
In this example extracted from one of our Success Cases page, the author used the table legend as a way to contextualize the reader so the results could be understood as a whole. You can read the full article here.
How to cite tables in research papers?
In general, it depends on the journal’s publication requirements. A good tip that will not cost you any time is to look at a recently published paper from your target journal for examples. That might give you the right direction to follow with your research document.
It would be best if you also kept in mind that the word “table” must never be abbreviated in in-text citations. It is always given simply as “Table” (e.g., Table 1). Another crucial point is that a table does not have parts like a, b, or c. If you have Table 1a and Table 1b, we recommend you merge them into one or split them into Table 1 and Table 2.
Use high quality scientifically accurate illustrations to communicate your science
Focus on the visuals! Mind the Graph is the perfect tool to illustrate your research paper properly.
Choose the plan that best suits you, subscribe now and start creating stunning infographics to increase your paper’s relevance.


Subscribe to our newsletter
Exclusive high quality content about effective visual
communication in science.