
Sometimes, I receive e-mails from scientists, engineers, teachers and other professionals saying: Oh, I love Mind the Graph, but is only for life scientists. Indeed, this is a common mistake. Initially, we focused on biological and medical illustrations, but we are growing and we want to empower scientists to create infographics, beyond the life sciences. Mind the Graph is an online infographic maker for all scientists.
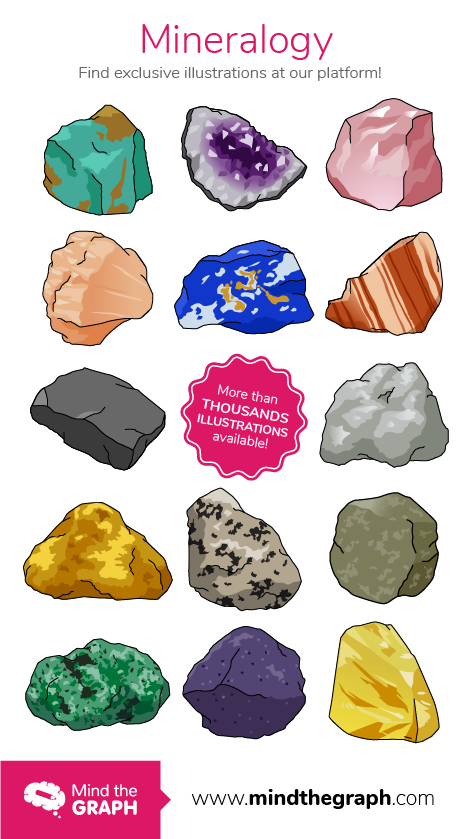
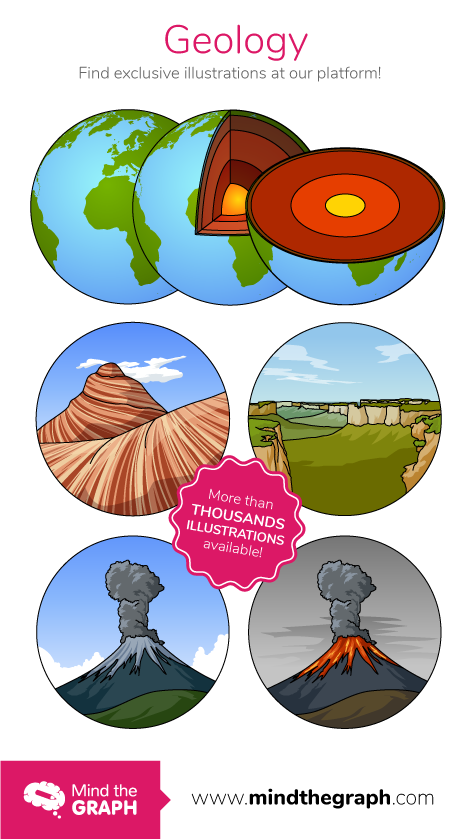
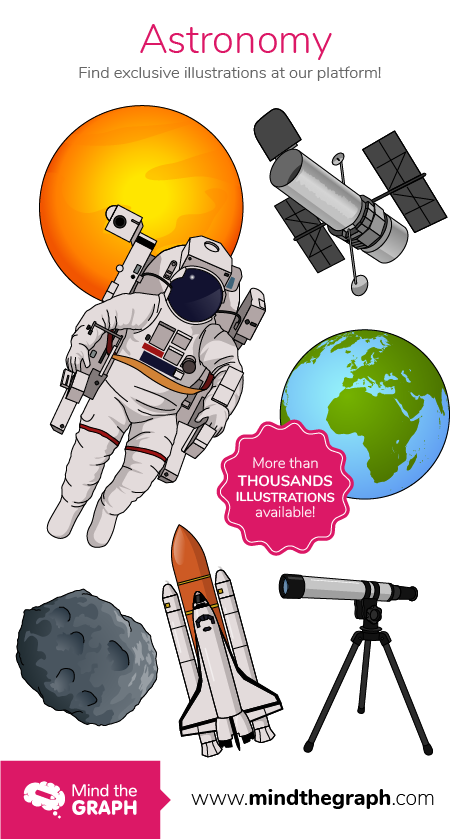
Therefore, we’ve add many illustrations of engineering, agriculture, astronomy, agronomy, geology, geography, human sciences, computer sciences, archeology, physics and more. Take a look at this selection of new illustrations:


Vil du ha flere illustrasjoner av fagområdet ditt? Ja, det kan du.
Mind the Graph: En infografikkprodusent for forskere. Alle vitenskapelige områder er inkludert.
I tillegg lager vi nye illustrasjoner på forespørsel. Det betyr at abonnenter kan be om nye illustrasjoner som blir tilgjengelige få dager etter at de er bestilt. Hvis du mener at ditt fagområde trenger flere illustrasjoner, er det bare å skrive til oss på contact@mindthegraph.com.
Also, feel free to contact us to send your feedback. What is your scientific field? What illustrations are you missing? Do you have a favorite illustration? We want to hear from you.


Abonner på nyhetsbrevet vårt
Eksklusivt innhold av høy kvalitet om effektiv visuell
kommunikasjon innen vitenskap.