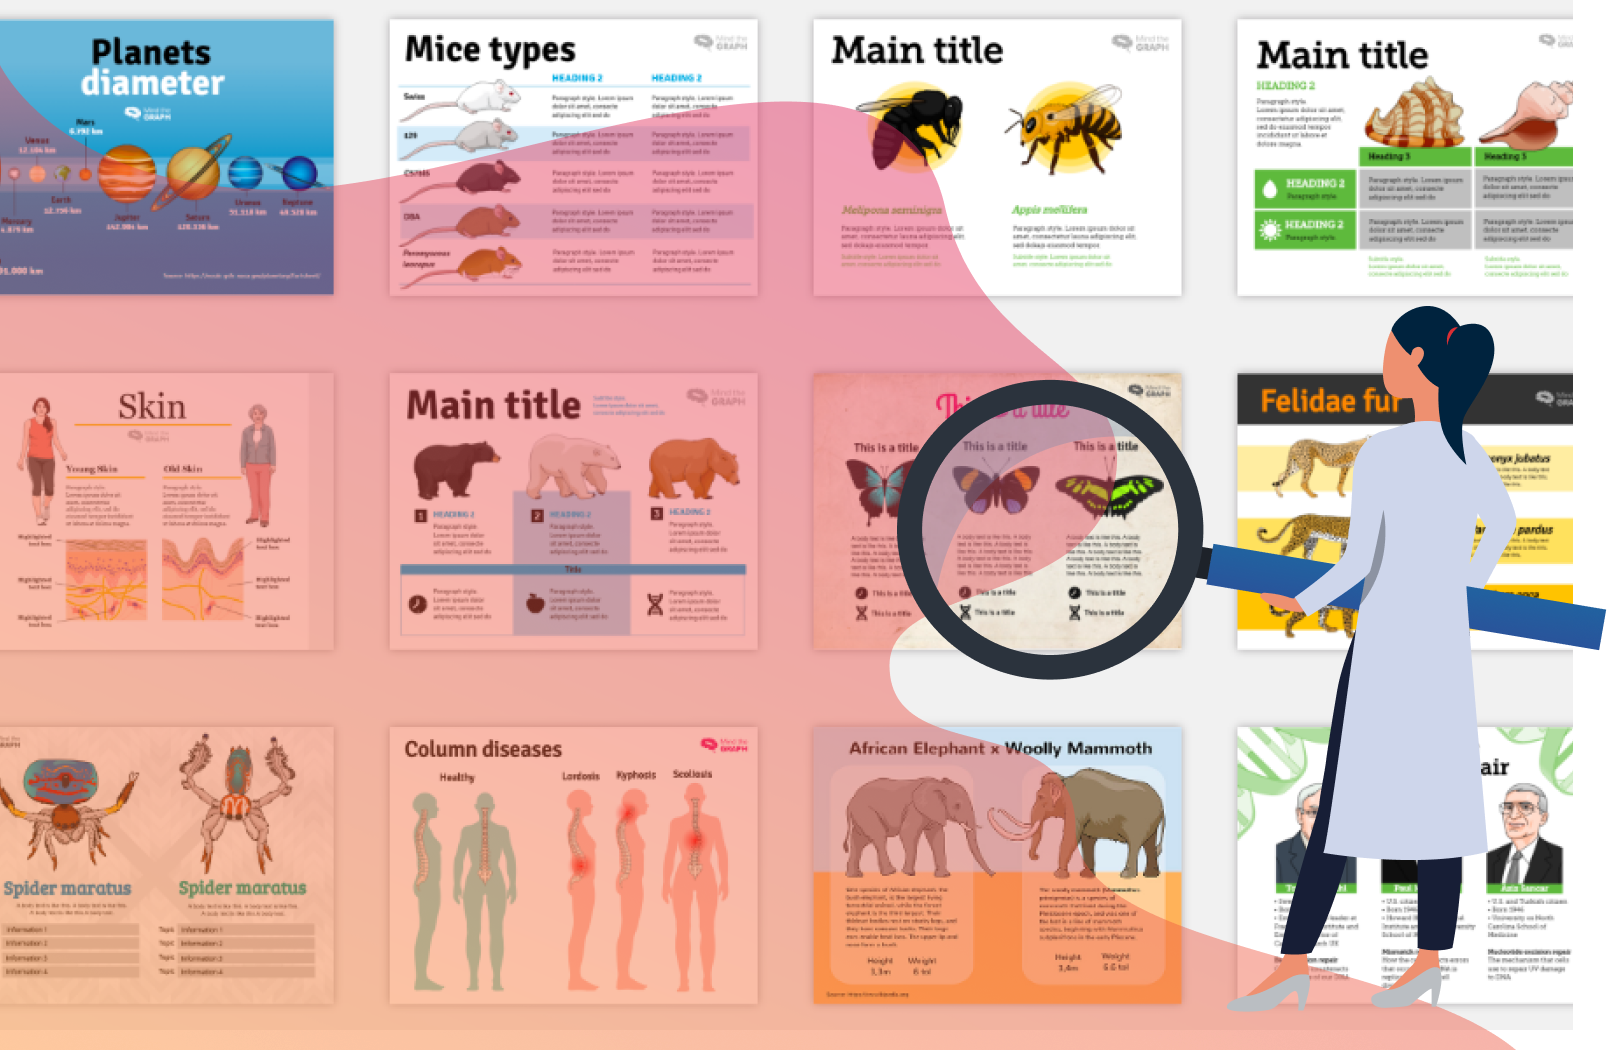
We provide templates to our users so they don’t need to start from a blank canvas. Is the best way to save time and create something eye-catching.
It is very simple to use a graphical abstract template. If you are a subscriber just go to our gallery and choose the best template for you, click on it and start creating your infographic. Also you can select a template inside your workspace. This way you can try different styles and select your favourite. If you aren’t a subscriber, you can use the templates as an inspiration to your creation or invest a few dollars to have access to all mind the graph features.
I found a graphical abstract template that I liked but it is not from my field of study. What now?
You can adapt the template, change the colors, icons and illustrations. All items are customizable allowing you to have an exclusive infographic.
Check out our video tutorial on how to customize a template:
Every week we add video tutorials on our youtube channel. Our designers produce videos with tips and suggestions to create a professional and attractive graphical abstract or presentation. The goal is to empower scientists and improve communication in science. We add new videos every week. Stay tuned!
Are you ready to start?

Subscribe to our newsletter
Exclusive high quality content about effective visual
communication in science.


