In statistics, significance levels are an important part of testing hypotheses. Furthermore, in contrast to other numbers in your statistical data, the significance level is not calculated by statistical analysis software. Instead, you select the level of significance. Have you ever questioned why this is so?
In this article, Mind The Graph will give you an overview of significance level so you can easily understand its functionality and importance.
What Is The Significance Level?
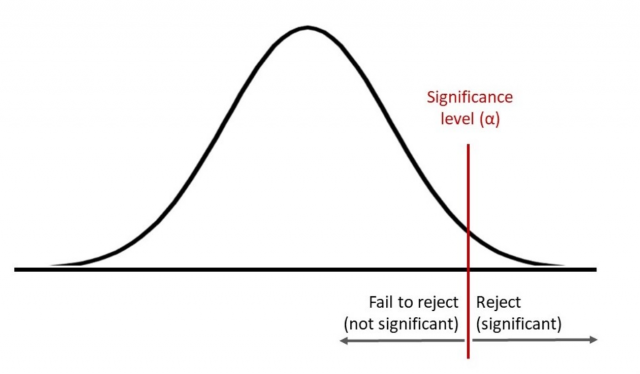
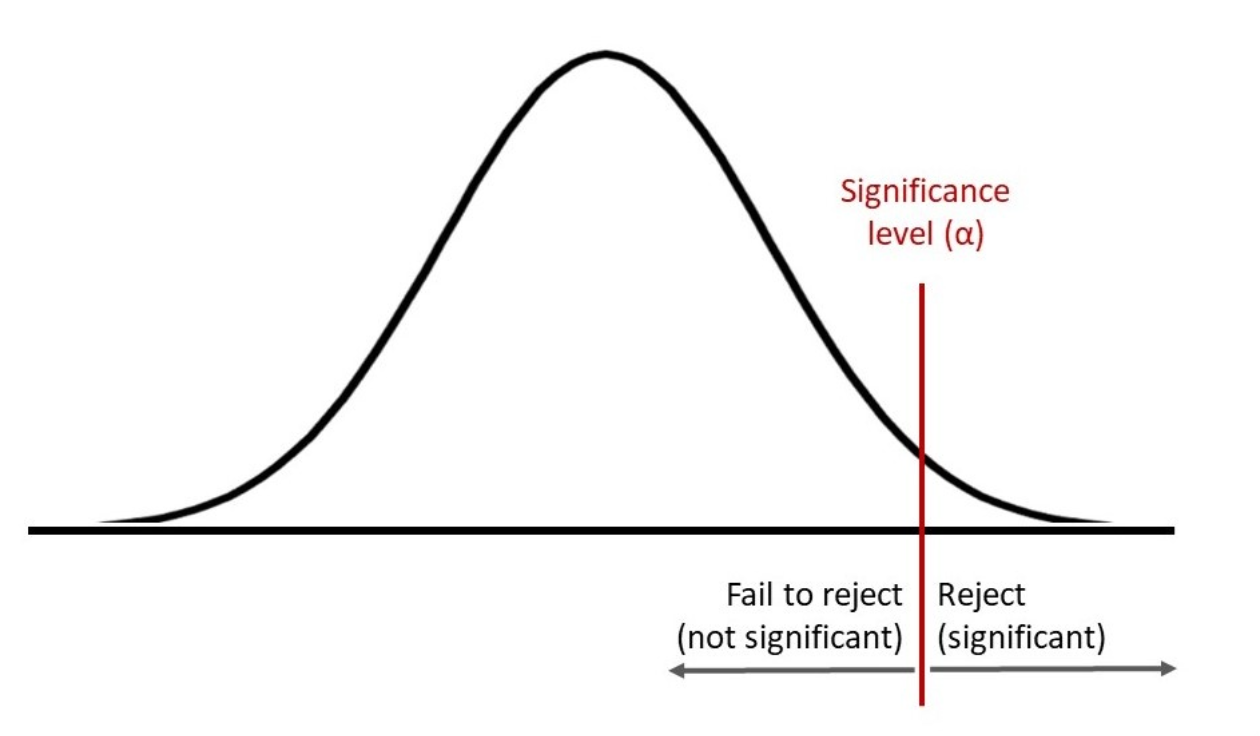
The significance level, also known as alpha or α, is a measurement that specifies the amount of evidence that must be shown in your sample before you reject the null hypothesis and declare the effect statistically significant. Even before you begin your experiment, you must choose a significance level.
To restate, it is the likelihood of rejecting the null hypothesis when it is true; for example, a significance level of 0.05 represents a 5% chance of deciding that a difference exists when there is none. Lower significance levels suggest that you need more evidence to reject the null hypothesis.

Significance Level Symbol
The level of significance is represented by the Greek symbol α (alpha). Level of significance = probability value (type I error) = α, in this case.
When values or observations deviate from the mean, they are less probable. The findings are denoted as “significant at x%.”
For instance, the value significant at 5% denotes a p-value less than 0.05 or p < 0.05. Similarly, significant at 1% denotes a p-value less than 0.01.


How To Find The Significance Level?
To determine the significance level of your finding, first determine the p-value, which defines the likelihood of discovering an effect that will answer whether or not the null hypothesis is correct. The null hypothesis is rejected if the p-value is less than the level of significance. If the p-value is greater than or equal to the significance level (α), the null hypothesis must be accepted.
The following is the common interpretation of the p-value at a level of significance of 10%:
If p > 0.1, null hypothesis is not assumed.
If p > 0.05 and p ≤ 0.1, low assumption of the null hypothesis.
If p > 0.01 and p ≤ 0.05, strong assumption of the null hypothesis.
If p ≤ 0.01, very strong assumption of the null hypothesis.
Just keep in mind that 0.05, or 5%, is the conventional alpha, and changing the significance level to something other than 0.05 usually necessitates a compelling reason.
Changing The Significance Level
Increasing the significance level from 0.05 to 0.10, for example, reduces the evidential standard. In contrast, lowering it from 0.05 to 0.01 raises the standard.
Assume you are evaluating the strength of party balloons to determine which brand is the best. Because a false positive will cause you to purchase the weaker balloon, the downsides are minimal. By lowering the significance level to 0.10, you may minimize the quantity of evidence required while increasing the possibility of a false positive from 0.05 to 0.10.
On the other hand, if you’re evaluating the strength of cloth used in hot air balloons, a false positive is extremely dangerous since it can lead to death. You must be very careful and select the finest manufacturer. It is preferable in this scenario to increase, rather than lower, the significance level to 0.01. This reduces the likelihood of a false positive ranging from 0.05 to 0.01.
Nothing Can Beat A Flawless Visual Piece That Delivers A Complex Message
Having difficulty in communicating a large quantity of information? Use infographics and illustrations to make your work more understandable and accessible. Mind the Graph is an excellent tool for researchers who want to make their work more effective by using visually attractive infographics.


Subscribe to our newsletter
Exclusive high quality content about effective visual
communication in science.