It is time to show the new Mind the Graph scientific illustrations. As you know, every week we add new scientific illustrations to our library on Mind the Graph. We already have over eight thousands illustrations now and all them are available to all mind the graph users (free users included). Moreover, most of our illustrations are based on requests from our subscribers. So, if you are a subscriber, you can request new illustrations at no extra cost. However, if you aren’t a subscriber yet, but you want to show your results in a visual way, don’t waste more time:
So, let’s see the brand new scientific illustrations:
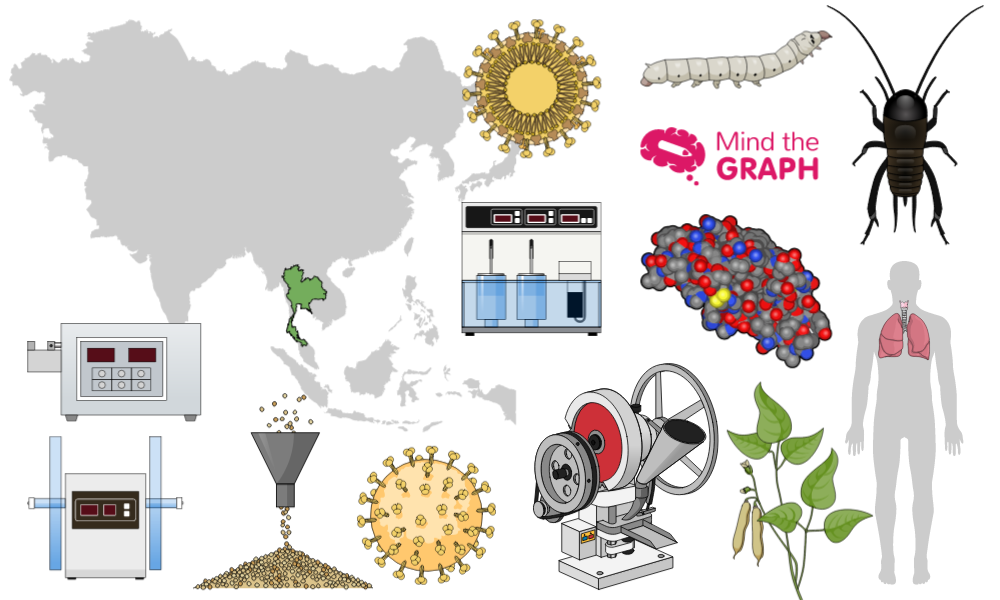
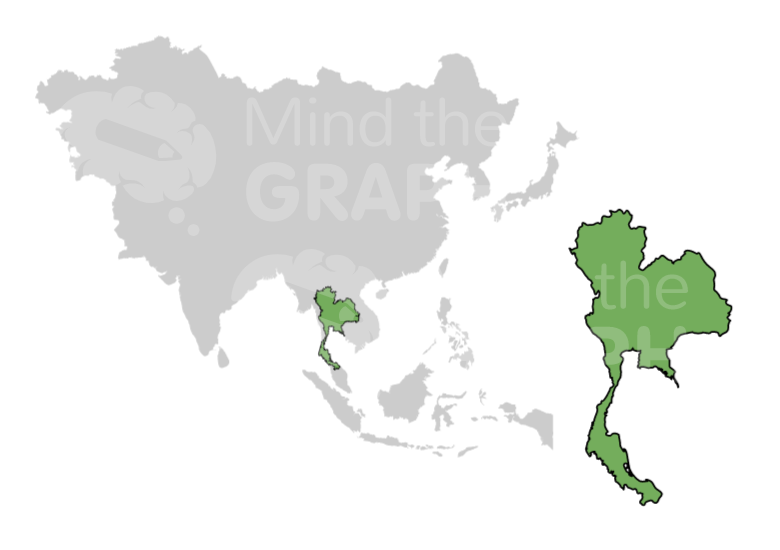
Thailand Map
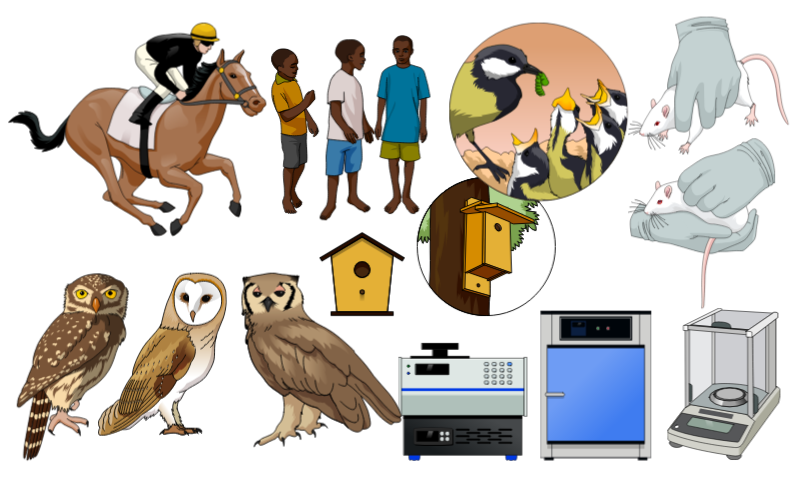
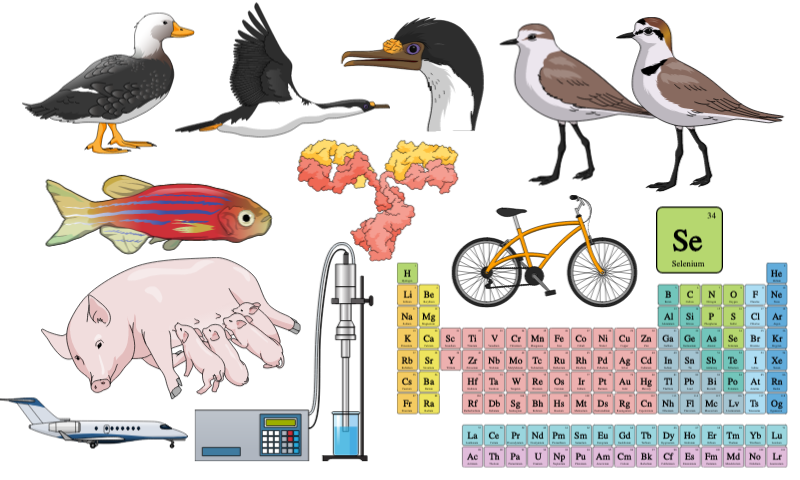
Lab equipments
Insulin Molecule
Respiratory system
Bean plant
Angle of repouse
Invertebrates
These illustrations and other thousands ones are available on Mind the Graph. You can use them to create graphical abstracts, infographics, papers, posters, classes and anything you want.
I want to use the scientific illustrations. What should I do?
You can use Mind the Graph for free and access thousands of scientific illustrations. You can use the free plan as long as you want. But if you want more resources, you should upgrade to the premium plan.
The premium plan has unlimited features. Even with all these illustrations available, it is possible that you still don’t find the one you need. Mainly if are working on a new experiment or treatment. But don’t worry. If you are a subscriber, you can request it at no extra cost. But, if you aren’t a subscriber yet, don’t worry too! You can upgrade now to enjoy all the benefits of a premium account.
So, if you want a specific illustration that you didn’t find on Mind the Graph or want the full features of an unlimited plan, it is time to upgrade:

Subscribe to our newsletter
Exclusive high quality content about effective visual
communication in science.

