2 min read
08/04/2016
Mind The Graph Scientific Blog is meant to help scientists learn how to communicate science in an uncomplicated way.
All scientific papers look the same when piled up. If you want to get published, you need to make your research catch everyone’s attention. You need to do something different. Scientific journals often have many detailed rules on how to fit a paper to an especific format. However, you don’t need to break the journal […]
A scientific presentation is the most ordinary way in Science to show our discoveries. Also, […]
Mind the Graph gave a talk at a Scientific Illustration Congress! If you couldn’t be […]
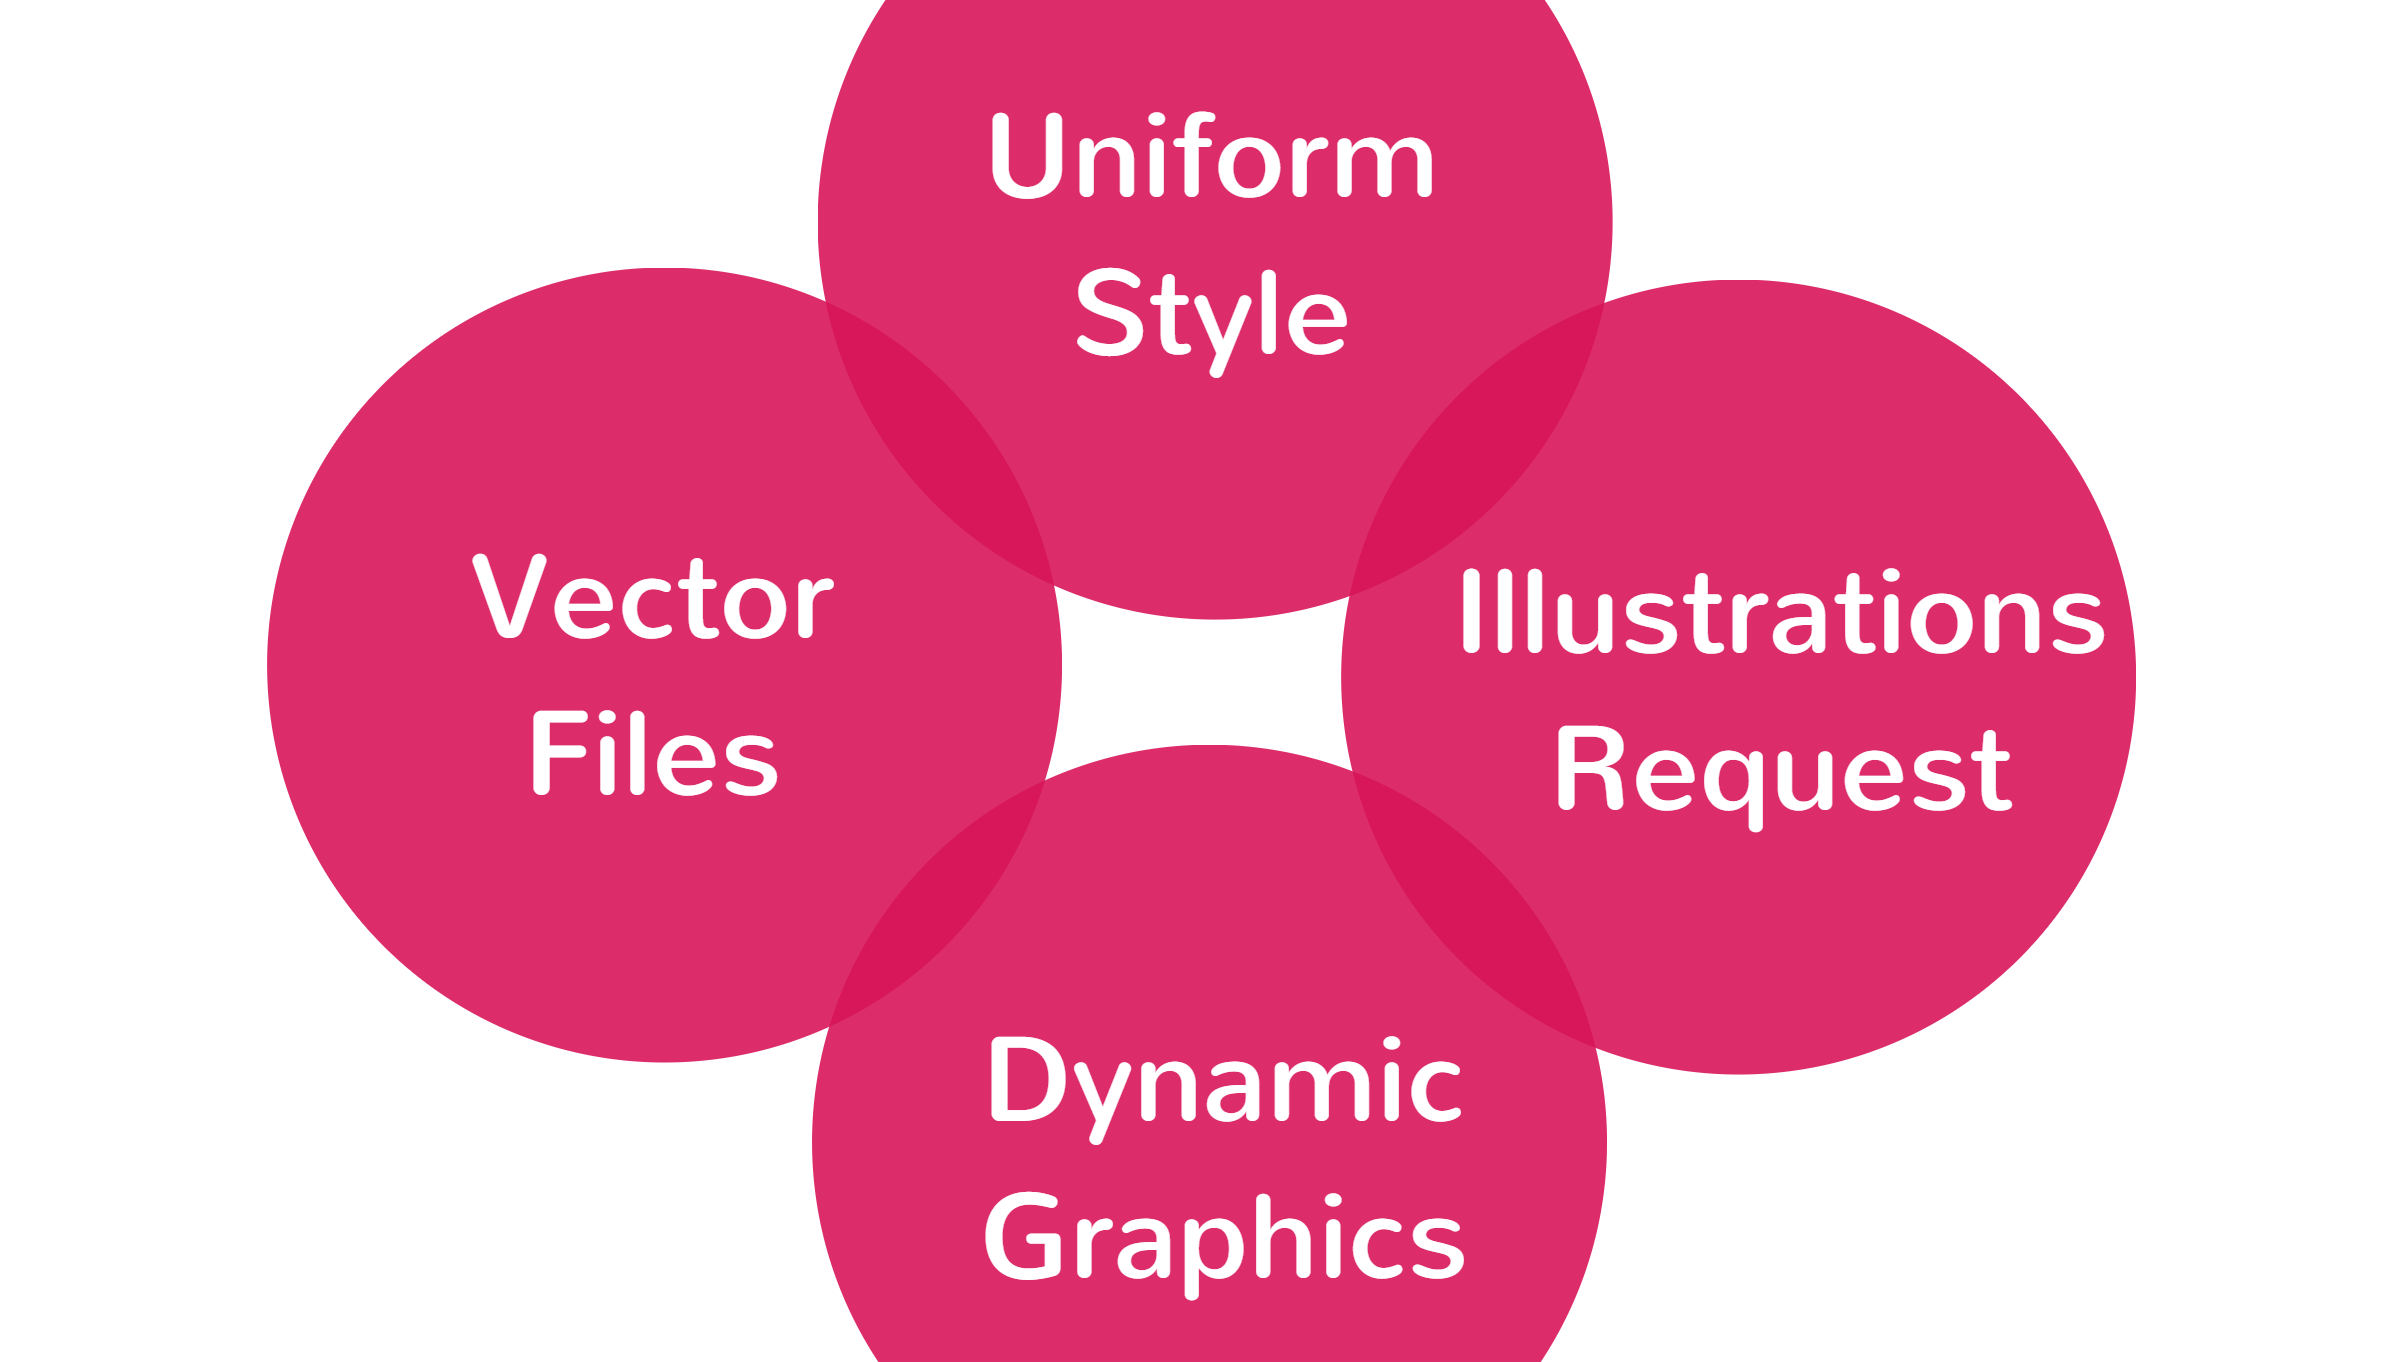
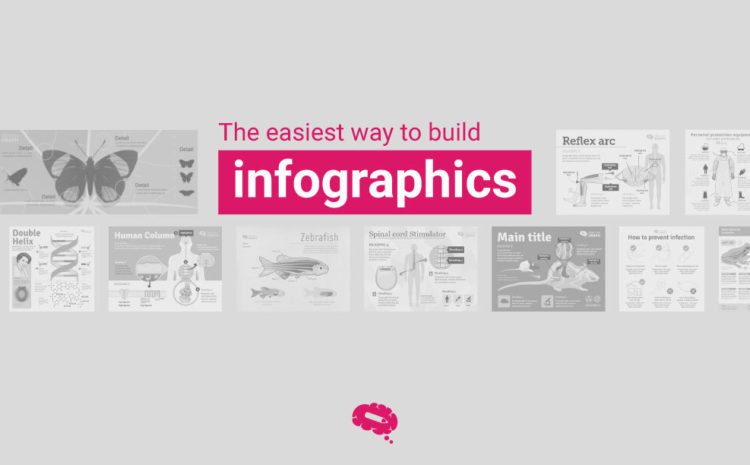
Build Infographics Ok, so you want to build infographics. You already know Mind the Graph. […]
The Zika virus has caught the world’s attention for the past few months after causing […]
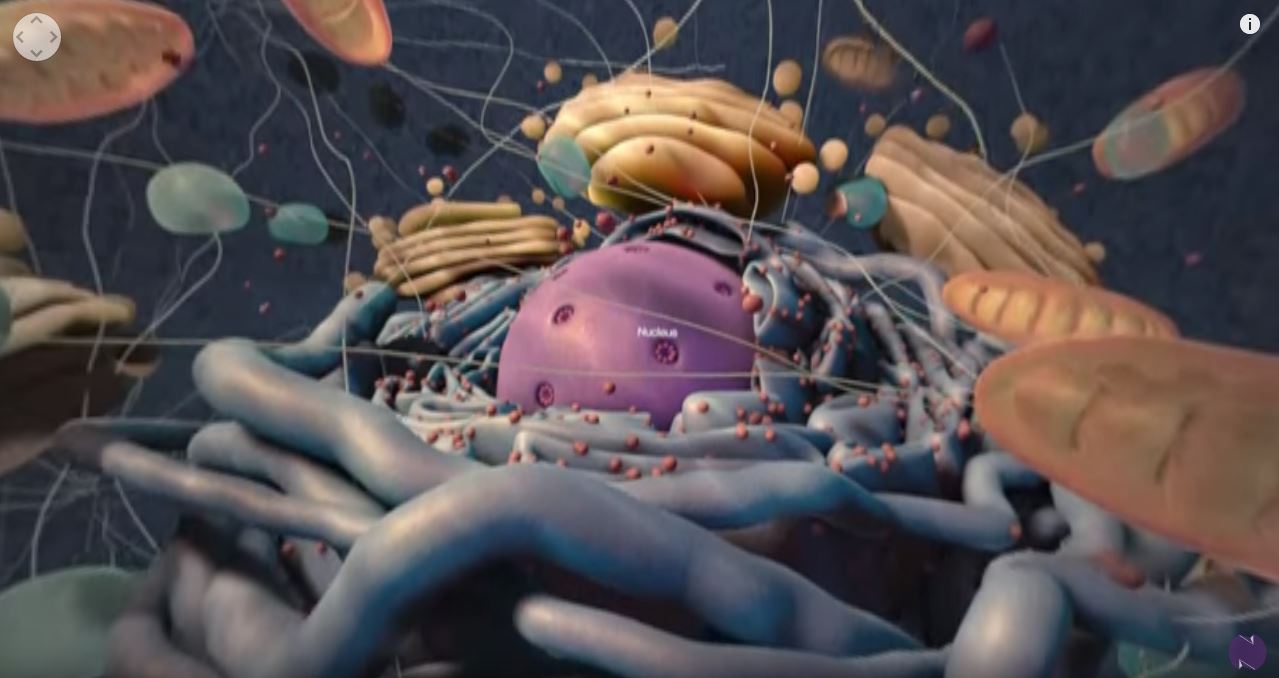
We talk a lot about how science is changing and becoming more interactive. Also, we […]
What if all scientific information in the world could be translated into something easier to […]
How many people do you know outside the scientific world that appreciates scientific blogs or […]
If you are one of our users, you probably have noticed that Mind the Graph […]
The human kind have always been in touch with diseases along evolution. Most diseases have […]
You know the feeling when you find out about an amazing tool or software? I […]
Hallo, wissenschafts liebhaber! This week Mind the Graph is in Germany and a german blog […]
What if you could have a figure browser to search for scientific illustrations? It sounds […]