2 min read
06/06/2019
Mind The Graph Scientific Blog is meant to help scientists learn how to communicate science in an uncomplicated way.
One of Brazil’s most valuable assets is its dense covering of rainforests. Of course, the Amazon Rainforest is the most significant of these. The forest covers a vast portion of the country. Besides that, the Amazon rainforest provides the ideal habitat to approximately one-third of all animal species in the world. To date, there have been […]
It is always amazing to show the scientific work of our users. So, today I will […]
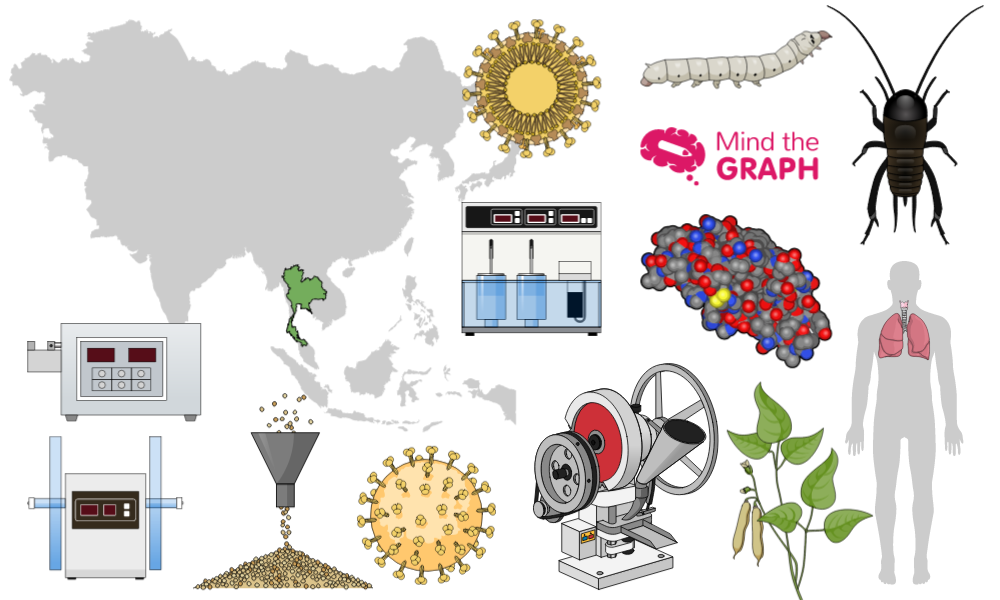
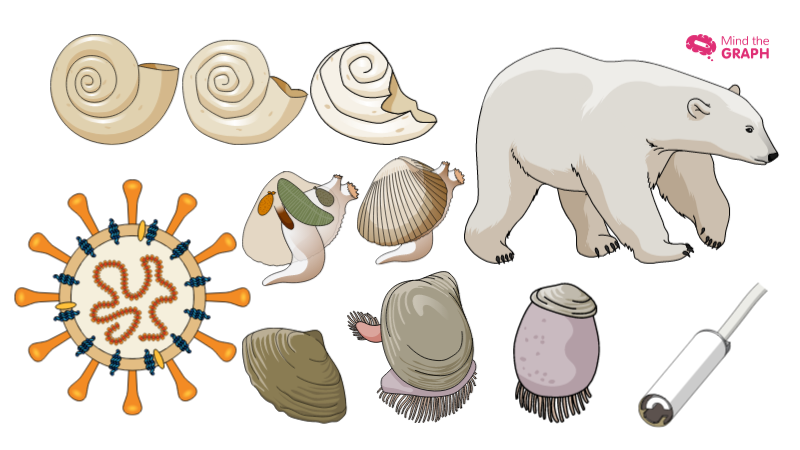
It is time to show the new Mind the Graph scientific illustrations. As you know, […]
Nothing is so good that it can’t be better, am I right? The last weeks […]
Mind the Graph é uma plataforma com milhares de ilustrações científicas que permite criar resumos […]
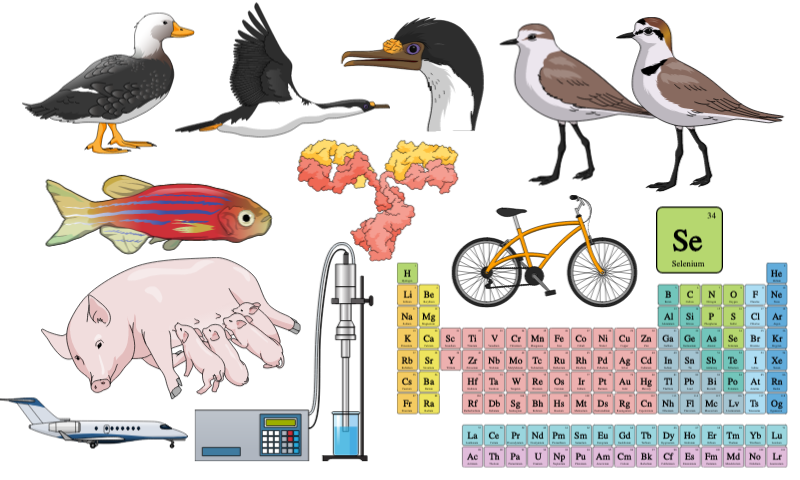
It’s friday again (YAY), so it’s time to see the new scientific illustrations of the […]
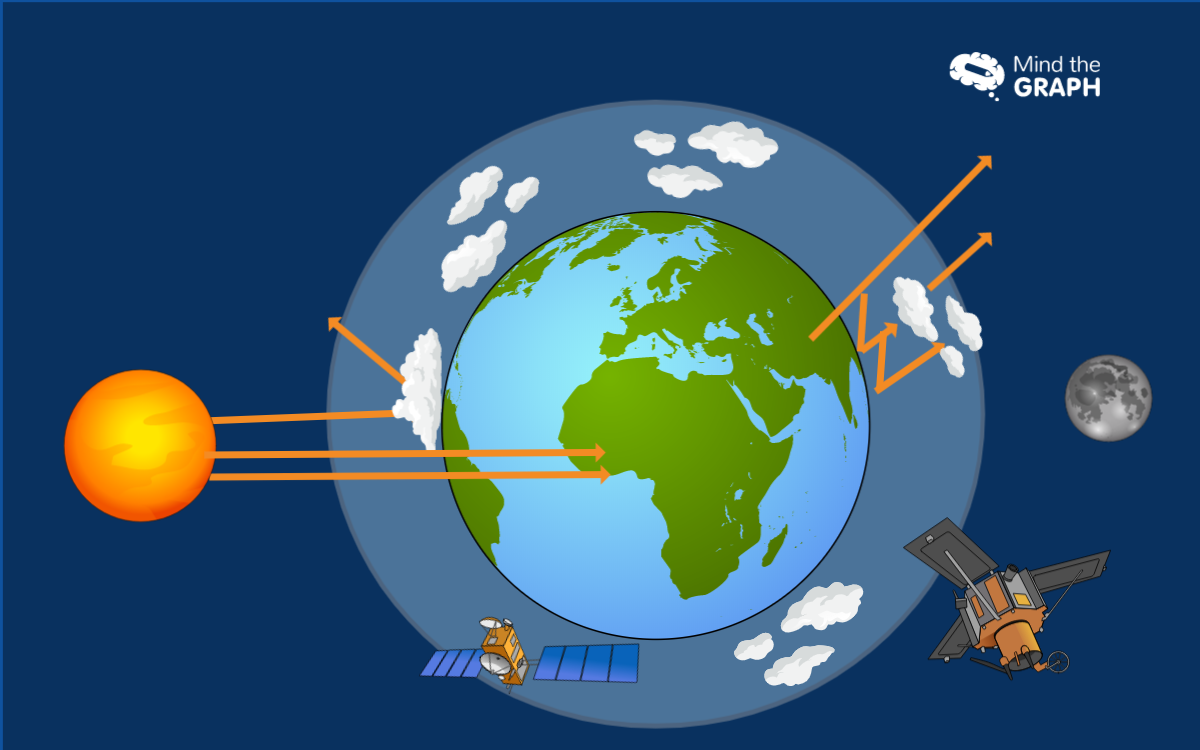
Carbon dioxide is a common gas present in the atmosphere. Normally, the Earth’s carbon cycle […]
Carbon dioxide is a common gas present in the atmosphere. It has an important role […]
É hora de ver as ilustrações científicas que adicionamos à plataforma Mind the Graph na […]
Science must to be about curiosity and questions, not dogmas and canned responses. So, teachers need […]
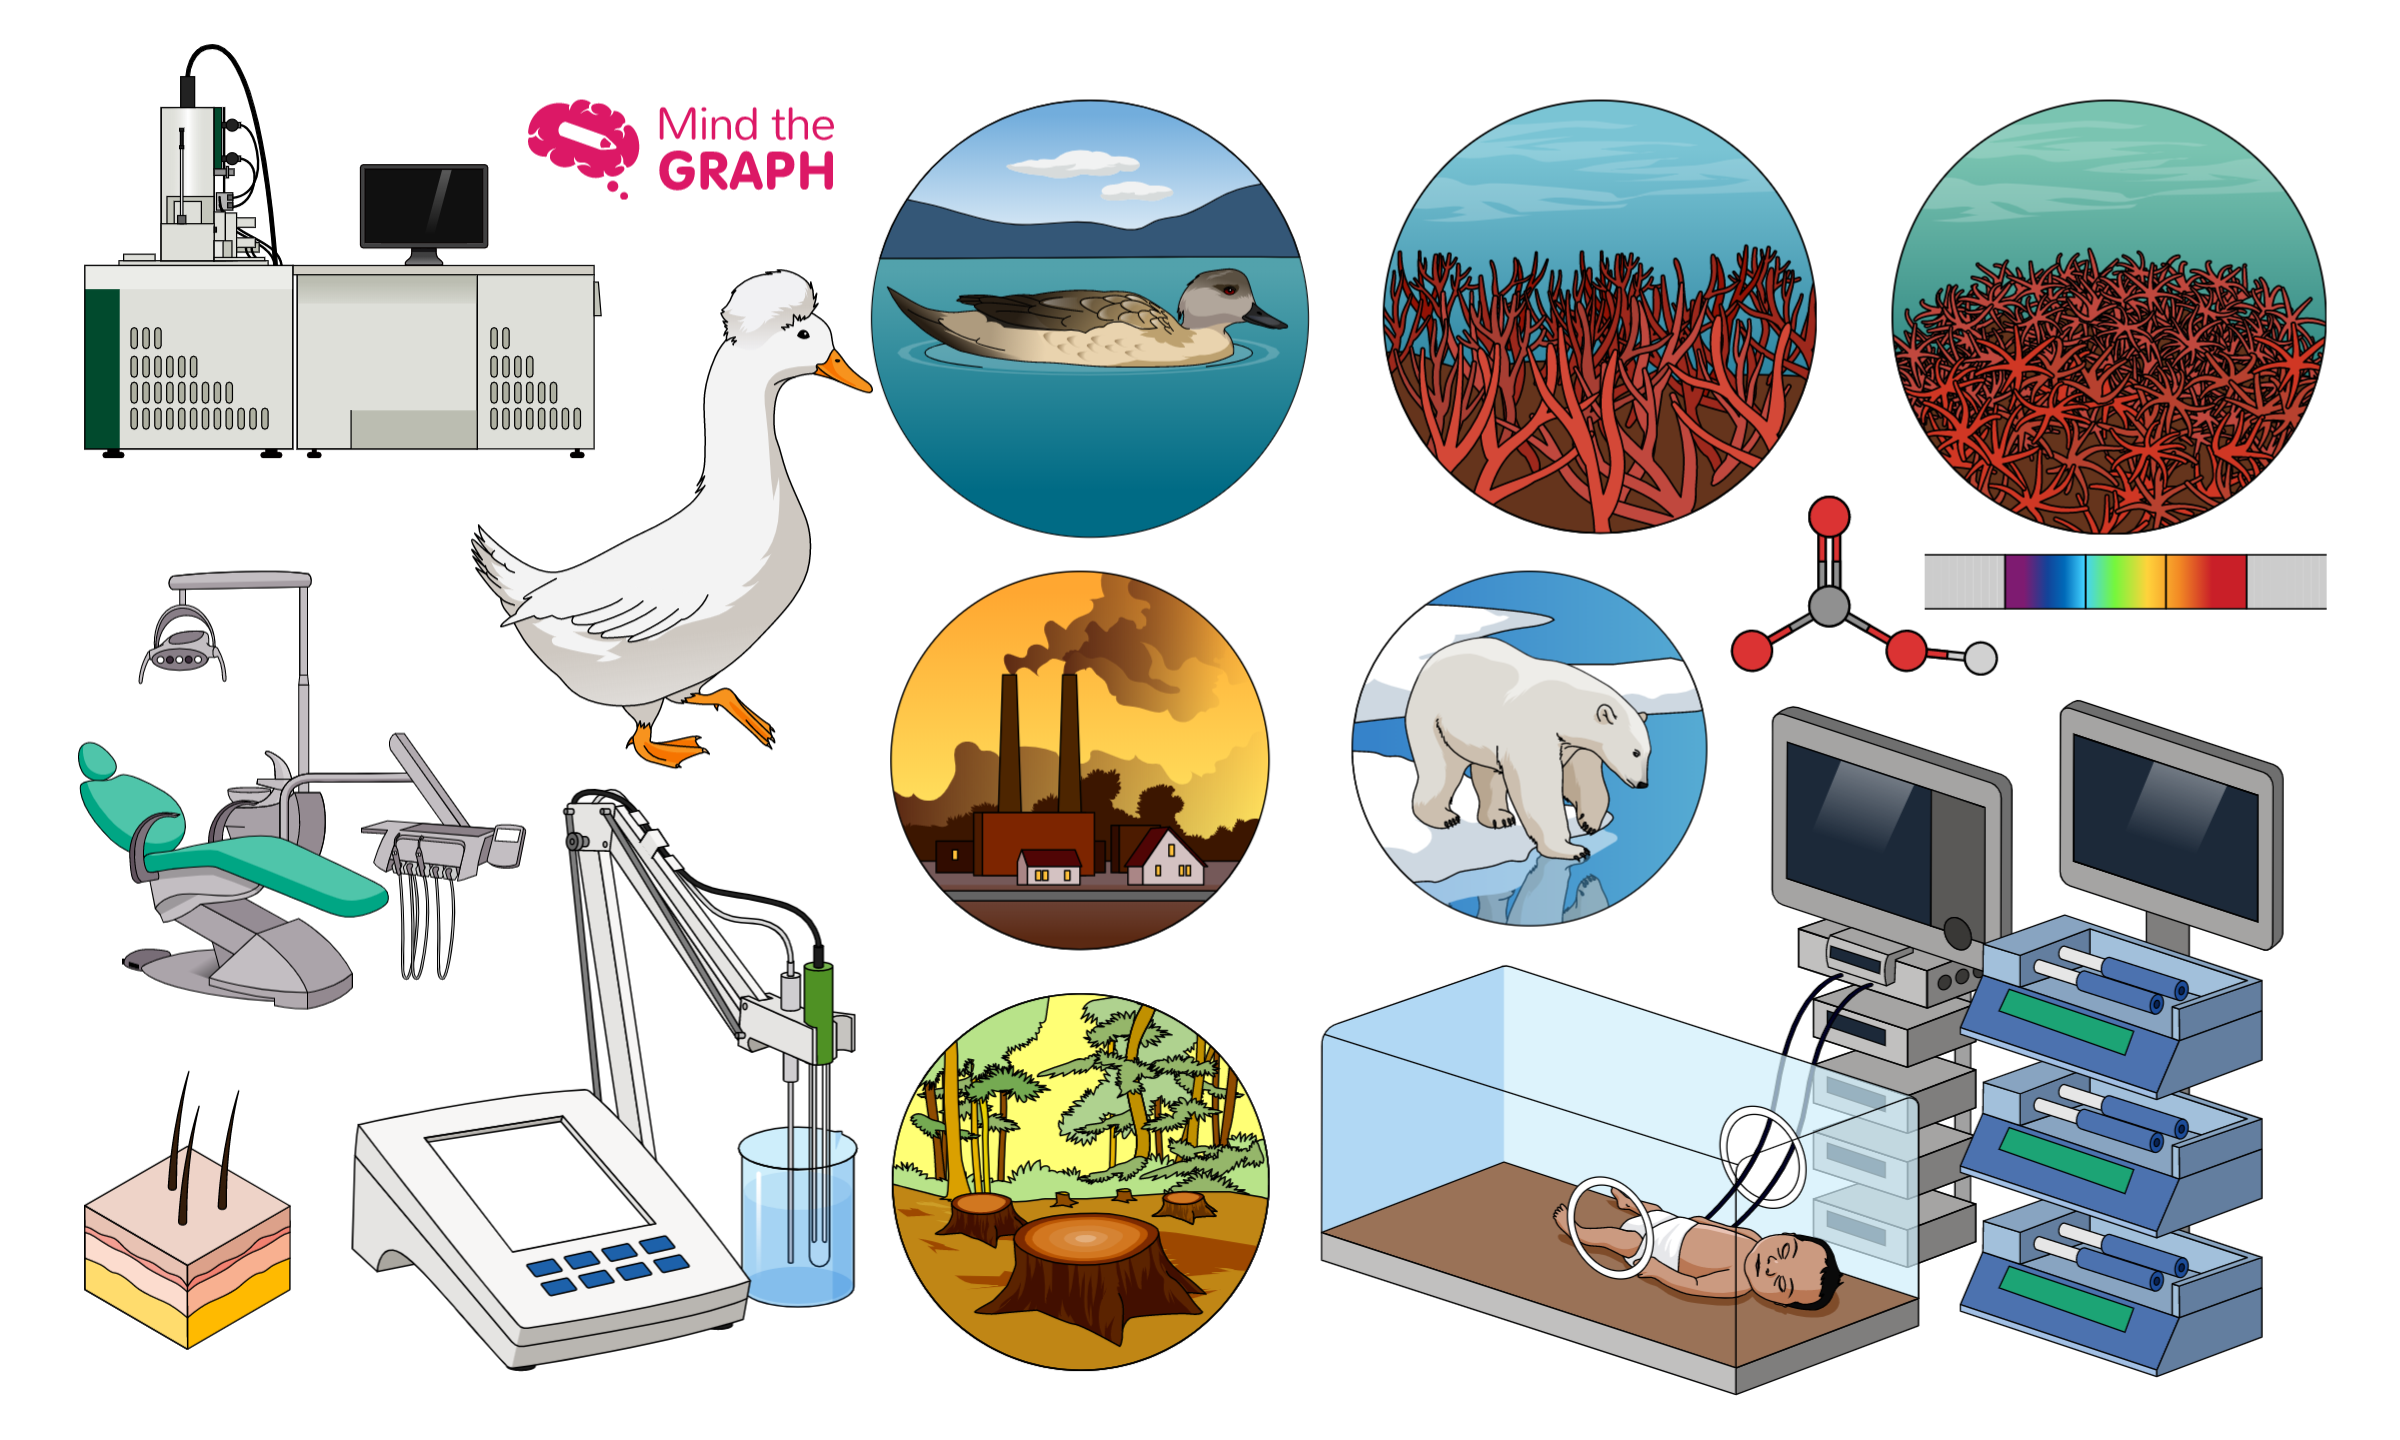
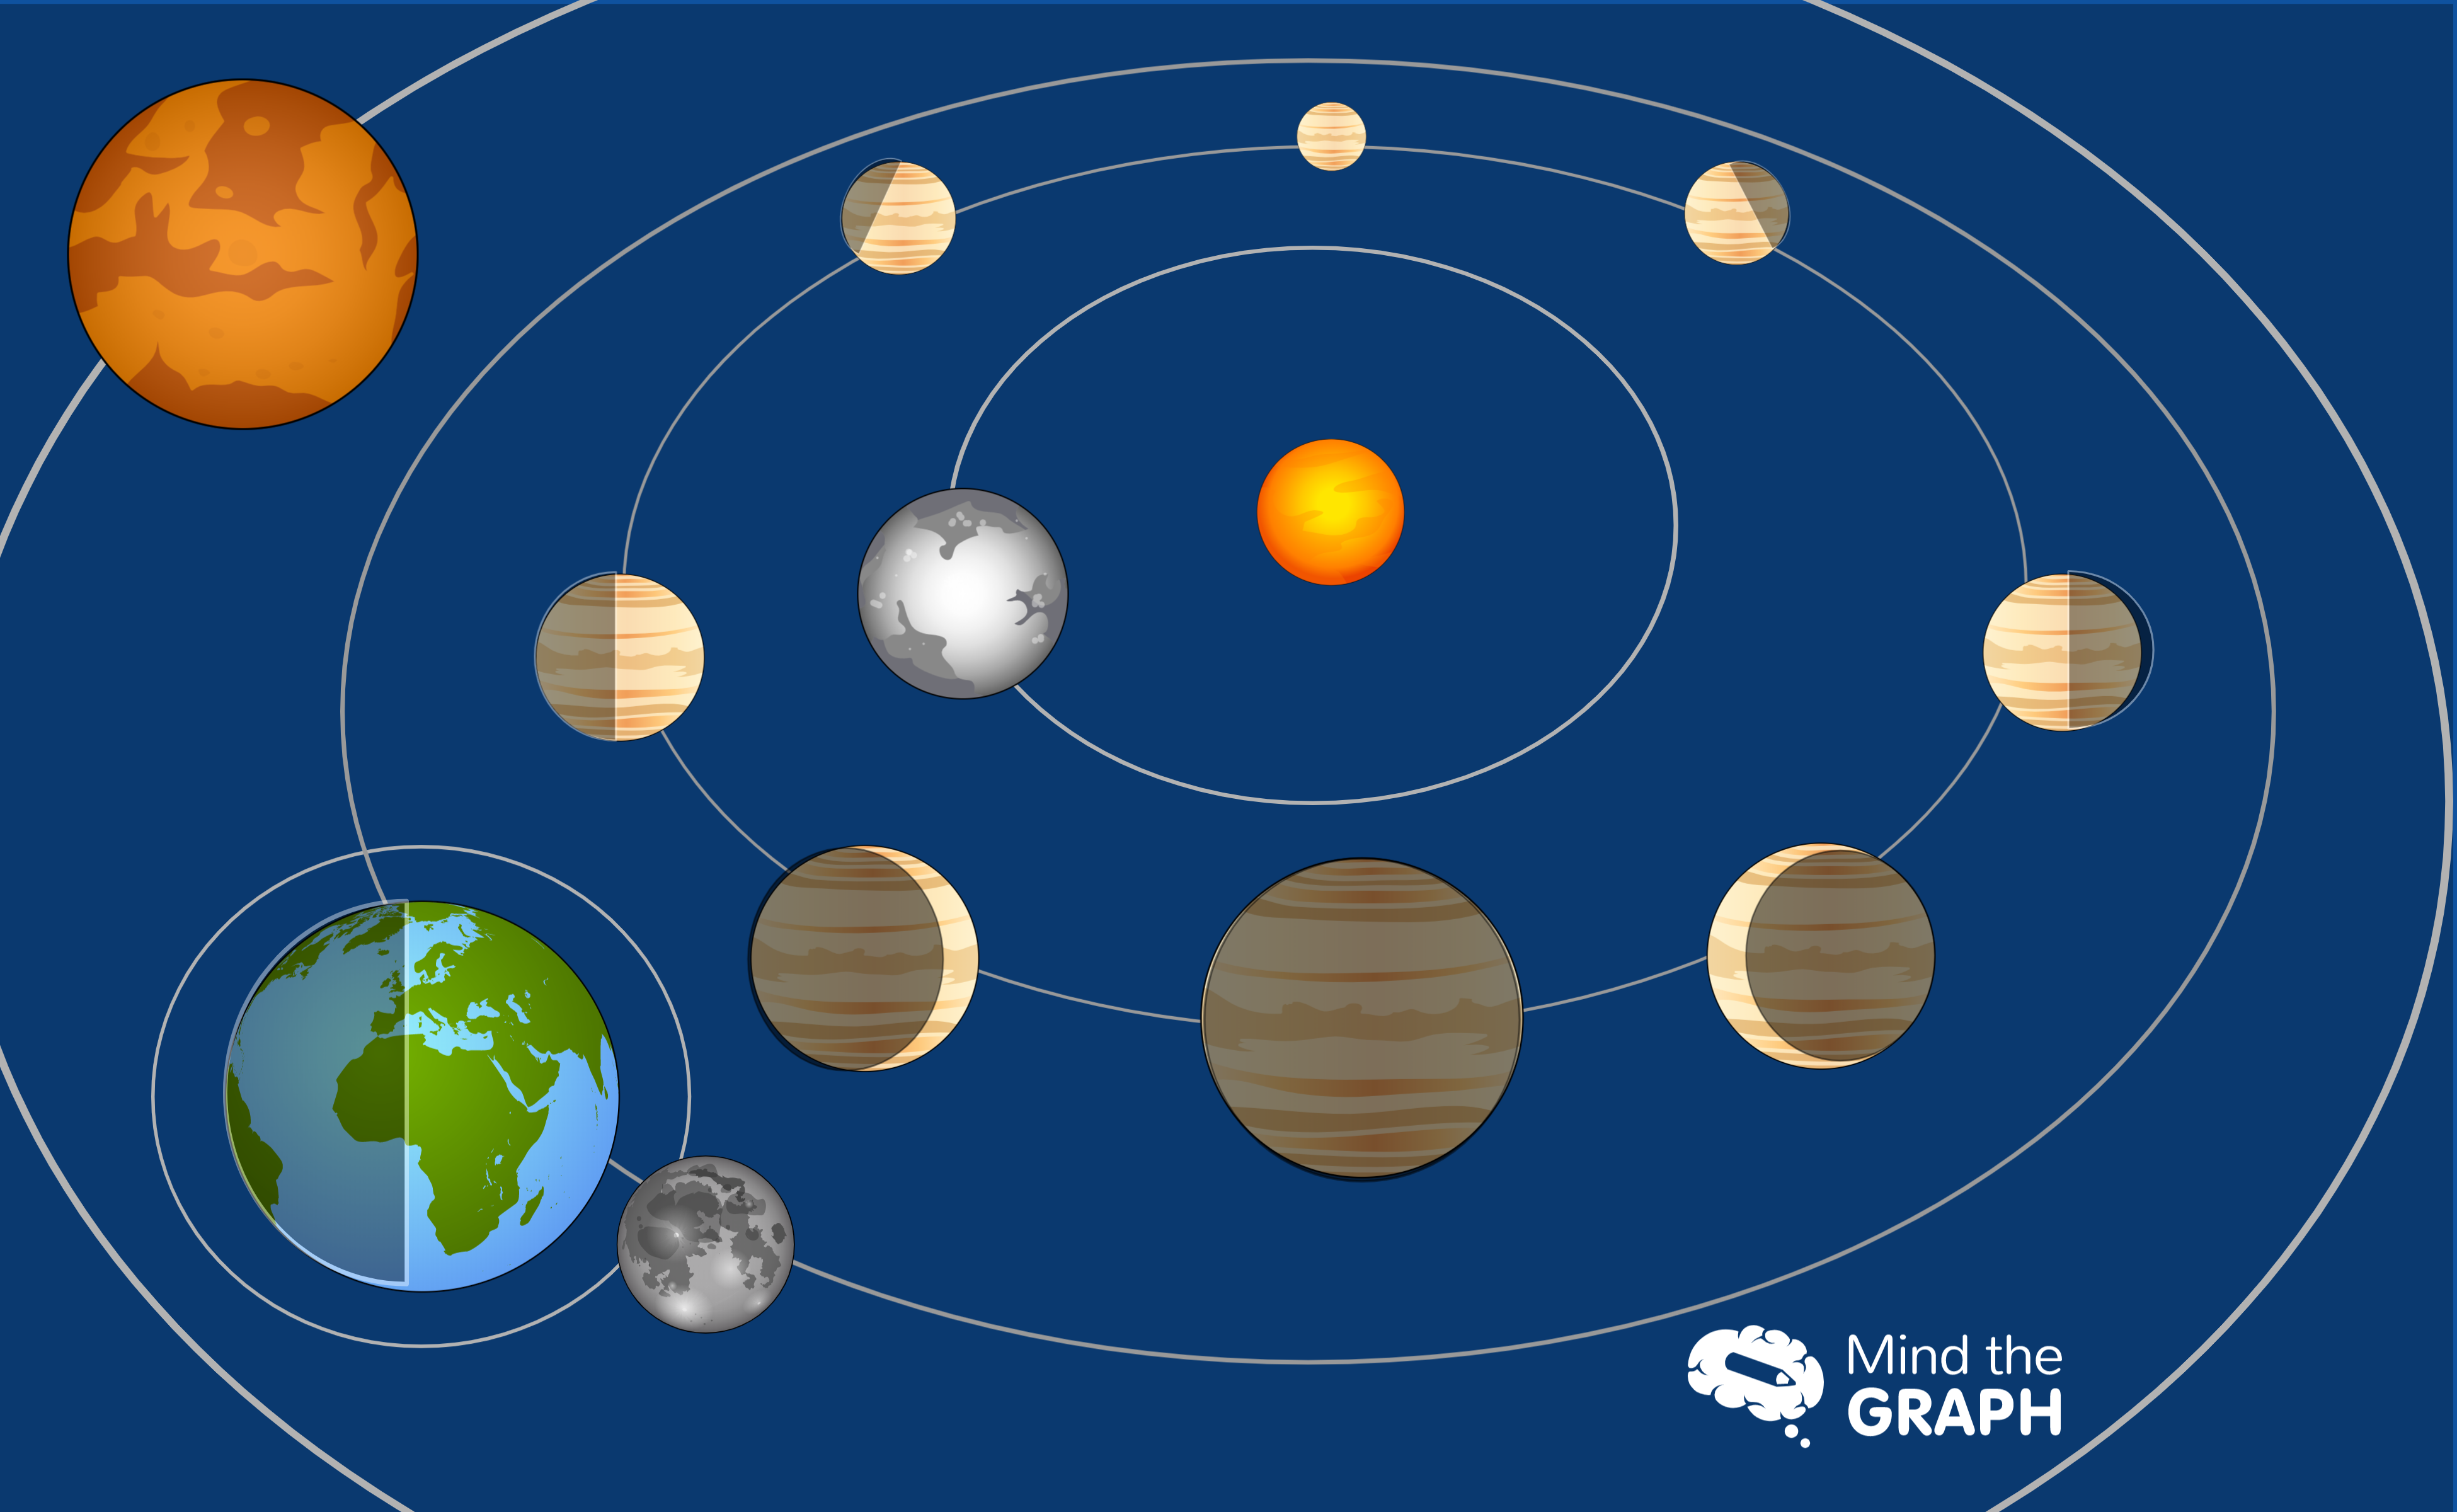
It is time to show the new Mind the Graph scientific illustrations. As you know, […]
Não é fácil ser médico. Além de estar constantemente atualizado sobre novos procedimentos e tecnologia, […]
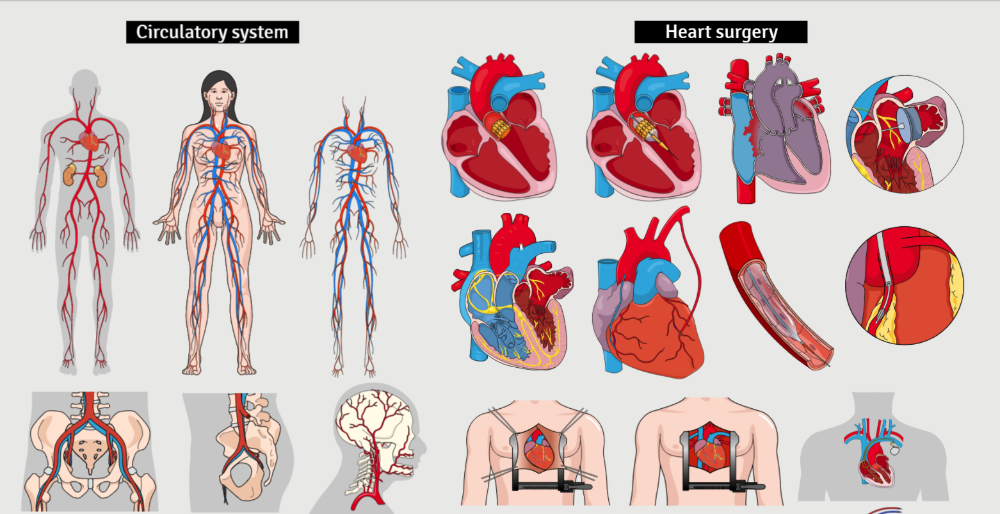
Images of circulatory system diseases like heart lesions are very useful for patient and parent […]