2 min read
05/08/2020
Mind The Graph Scientific Blog is meant to help scientists learn how to communicate science in an uncomplicated way.
This tutorial video shows you how to create an infographic on Mind the Graph. The […]
Tutorial video on how to create an attractive infographic with scientific illustrations on Mind the […]
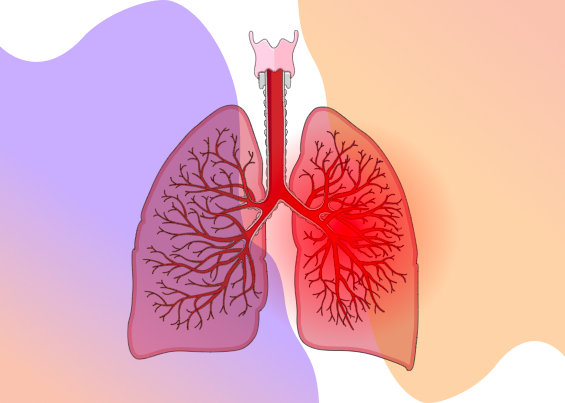
I wanna use medical scientific illustrations from Mind the Graph. How can I do that? […]
Tutorial video on how to create an attractive vaccination infographic with scientific illustrations on Mind […]
I wanna use medical scientific illustrations from Mind the Graph. How can I do that? […]
Tutorial on how to create an attractive vaccination infographic with scientific illustrations on Mind the […]
Do you know how important the personal protective equipments (PPE) are to prevent exposure to […]
I already have an opinion, but let’s cover all the available theories: 1) The most […]
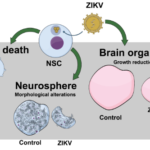
3) From the cellular perspective, the coronavirus mechanism of infection recognize ACE2 receptors on the […]