4 min lesning
01/18/2023
Vitenskapsbloggen Mind The Graph er ment å hjelpe forskere med å lære å kommunisere vitenskap på en ukomplisert måte.
Forskere har nylig gjort fremskritt innen kjernefysisk fusjon. Ta en titt på denne enkle introduksjonen for å lære alt om dette.
Finn ut hvordan du best lager en spilleliste for produktivitet som kan øke hjerneaktiviteten og prestasjonene dine.
I denne artikkelen gir vi deg en oversikt over signifikansnivået slik at du enkelt kan forstå dets funksjonalitet og betydning.
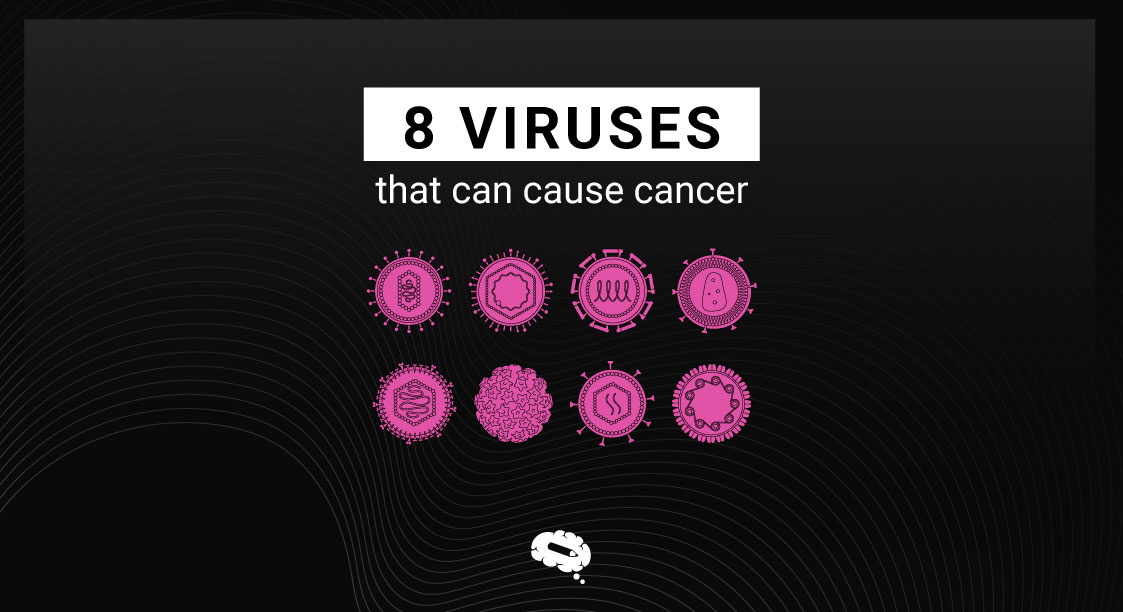
Virus er enkle å forebygge når du først har lært dem å kjenne. Lær om de 8 ulike typene som kan forårsake kreft, og hvordan du kan unngå dem.
Alle fagfelt har problemer, og vitenskap er intet unntak. Forstå hva vitenskapelig uredelighet er, og hvilke typer det finnes.
EBV er et av de mest utbredte virusene hos mennesker siden det vanligvis overføres via spytt. Finn ut mer om det og hvordan du kan unngå det.
Cronbach's Alpha er den beste metoden for å vurdere undersøkelsens pålitelighet. Les mer om den og hvordan du tolker den.
Finn ut hva bærekraftig drivstoff er, hvordan det bidrar til å redusere karbonavtrykket i miljøet og hvor viktig det er.
Cellulær- og molekylærbiologien har blitt mye bedre i det siste. Finn ut hva molekyldesign er og hvordan det revolusjonerer vitenskapen.
En studie har begge sider av medaljen, men vi overser ofte den negative siden. Lær mer om hva publikasjonsskjevhet er og hvordan du kan unngå det.
Lær mer om hva en bibliografi i en forskningsoppgave er, og hvordan du skriver en bibliografi som gjør forskningsoppgaven din helt perfekt.
Denne artikkelen vil lære deg alt du trenger å vite om Stiff Person Syndrome, en uvanlig autoimmun tilstand.
Det er vanskelig å skrive en oppgave, så lær deg forskjellen på en review paper og en research paper for å finne ut hva som passer best for deg.