Writing a scientific paper is difficult enough, right? Well, nothing is so bad that can’t get worse. For most people, one of the most difficult parts is how to present the scientific data. For this reason, we decided to give a little hand and help you with choosing the type of chart you should use!
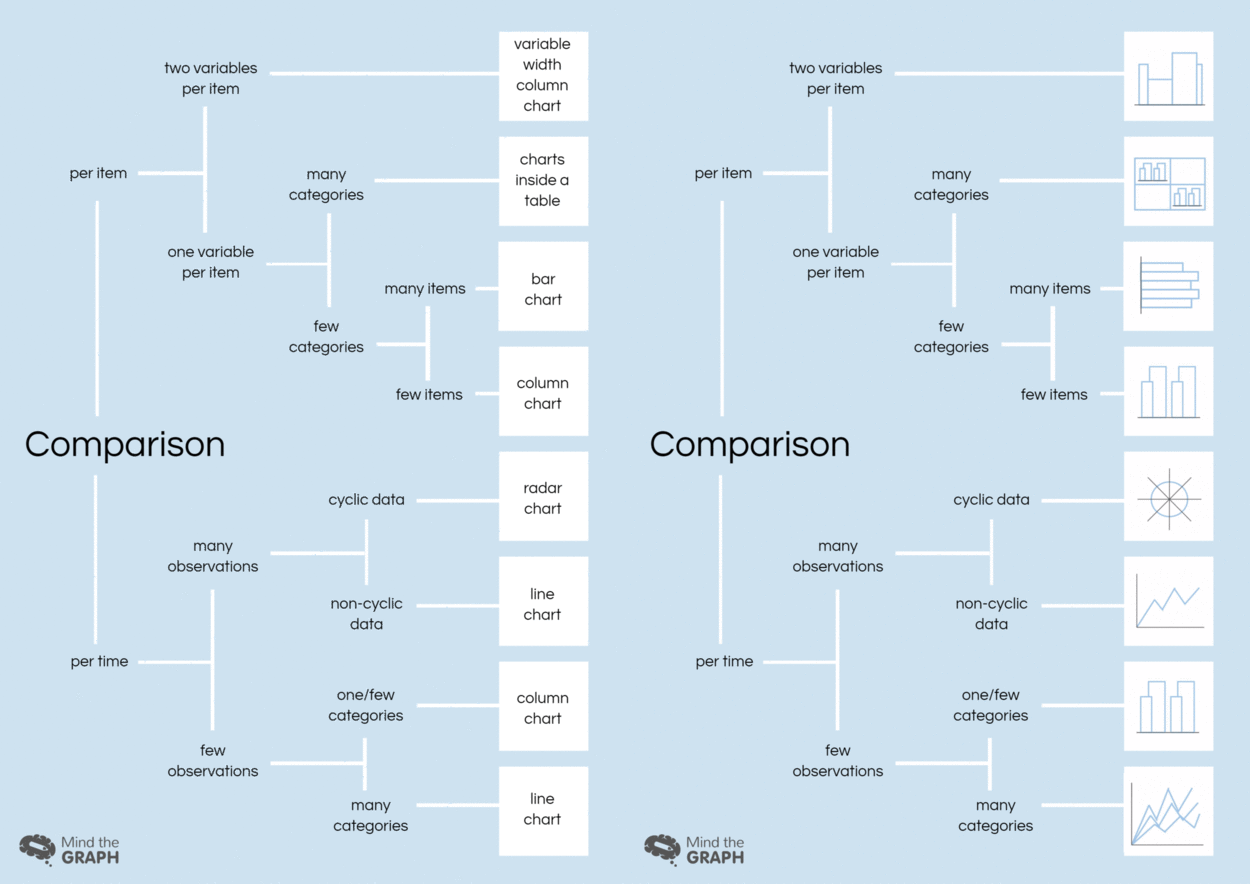
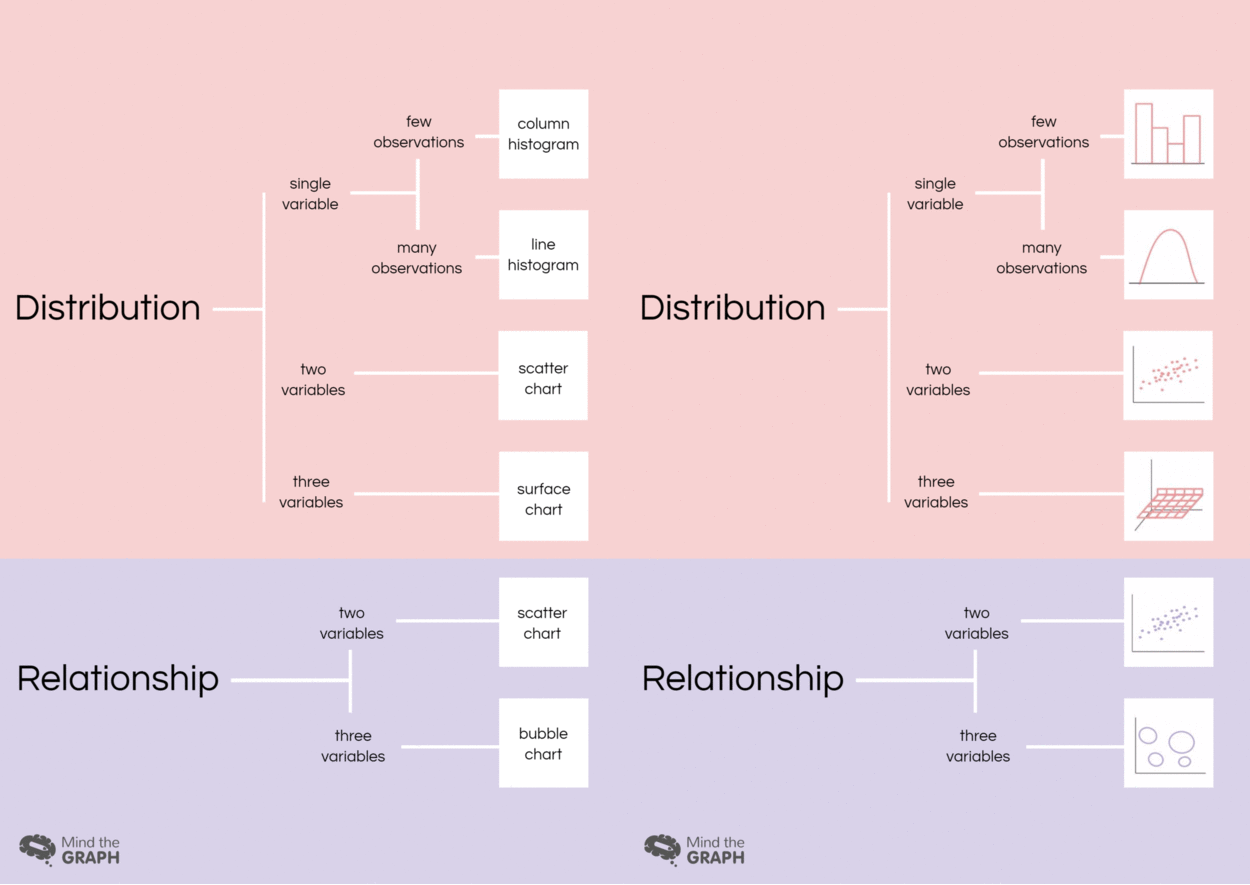
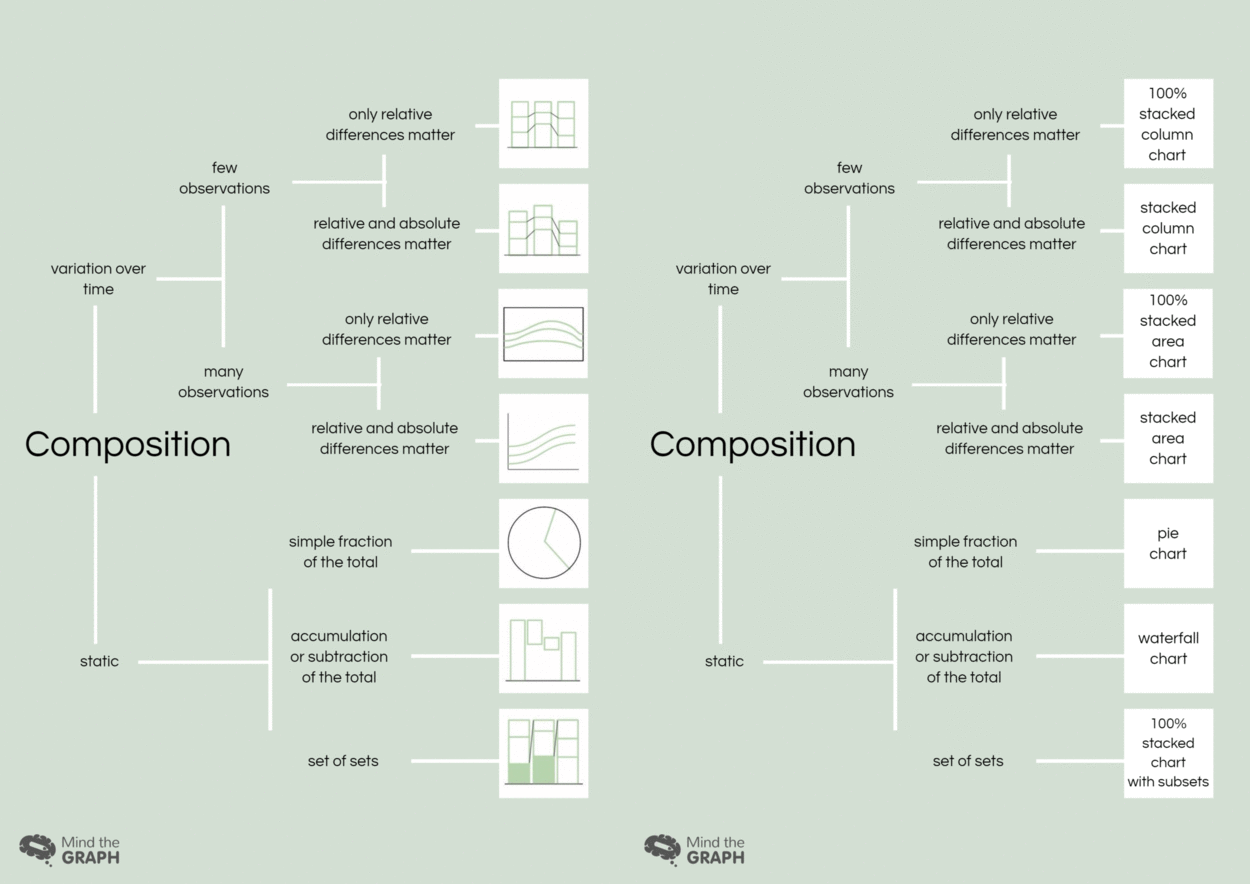
First things first, there are basically four types of data presentation: Comparison, Distribution, Relationship and Composition. Each of them has a set of charts especific for the type of data you have. If you are in doublt about what to use, ask yourself first “what is the nature of my data?”. Only after answering this question, you are ready to decide the right chart.
You already know the type of data you have? Awesome! You are ready to find out the best chart for your research!
Sammenligningstabell
Distribusjons- og relasjonsdiagram
Sammensetningskart
I dag sliter vi med en uoverskuelig mengde tilgjengelig informasjon. Denne mengden er overveldende og hindrer oss i å holde oss fullt oppdatert hele tiden. Derfor er det ekstremt viktig å kommunisere godt. Det vil si å gjøre seg forstått på en enkel måte. Dette er spesielt viktig i den vitenskapelige verden, siden det å kommunisere godt kan avgjøre om forskningen din blir lagt merke til eller ikke.
If your readers are having a hard time trying to figure out what you are saying, it means your communication has failed. The right chart can help you making your communication efficient.
A scientific paper demands a lot of energy and time. It is always a good idea to think about the tools you use to build and present it. If you also need some help with other parts of your research, read our post "8 tips for å forbedre forskningen din" .
Føler du deg klar til å skrive ditt livs beste vitenskapelige artikkel?

Abonner på nyhetsbrevet vårt
Eksklusivt innhold av høy kvalitet om effektiv visuell
kommunikasjon innen vitenskap.

