2 min read
01/10/2017
Mind The Graph Scientific Blog is meant to help scientists learn how to communicate science in an uncomplicated way.
Oh yes! Mind the Graph is back from the holidays and ready for 2017! 2016 was a big year for Mind the Graph. We had amazing scientists all over the world collaborating with us; big business trips; huge changes in our platform to improve our customer’s experience; and – last but not least – we […]
Hey there, science friend! So you want your Christmas present, right? Awesome, here it is! […]
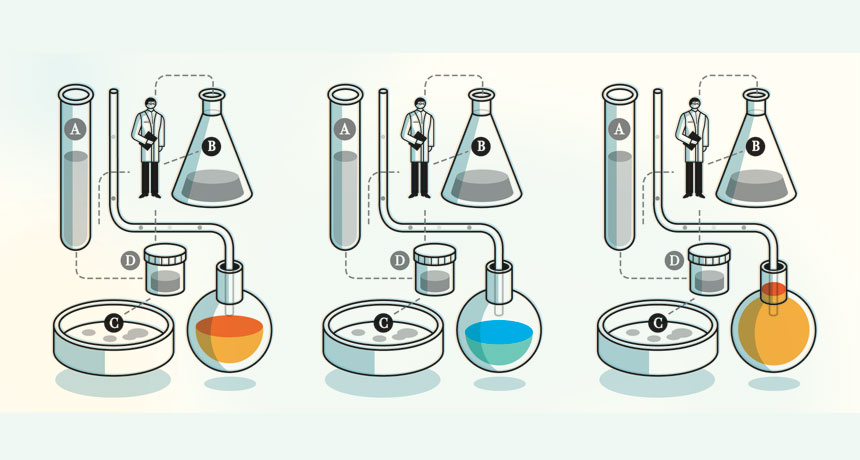
The publishing method comes with a couple of rules. One of the most important is […]
BREAKING NEWS: Mind the Graph has been upgraded! What does it mean? That we have […]
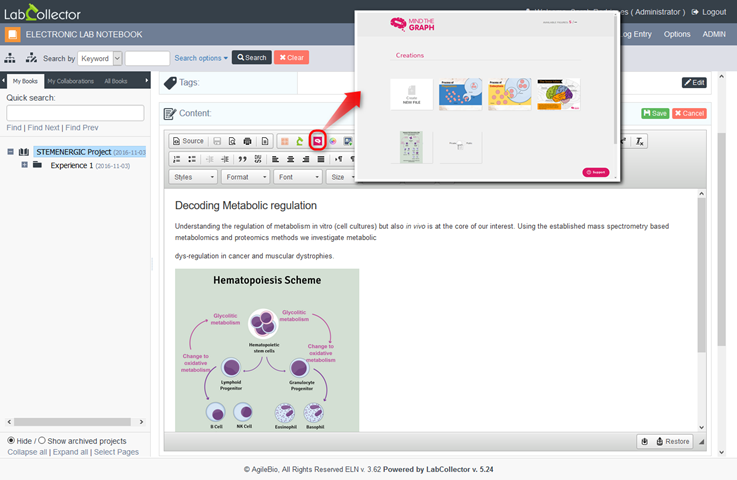
Mind the Graph and LabCollector are finally working together! Now you can have all your […]
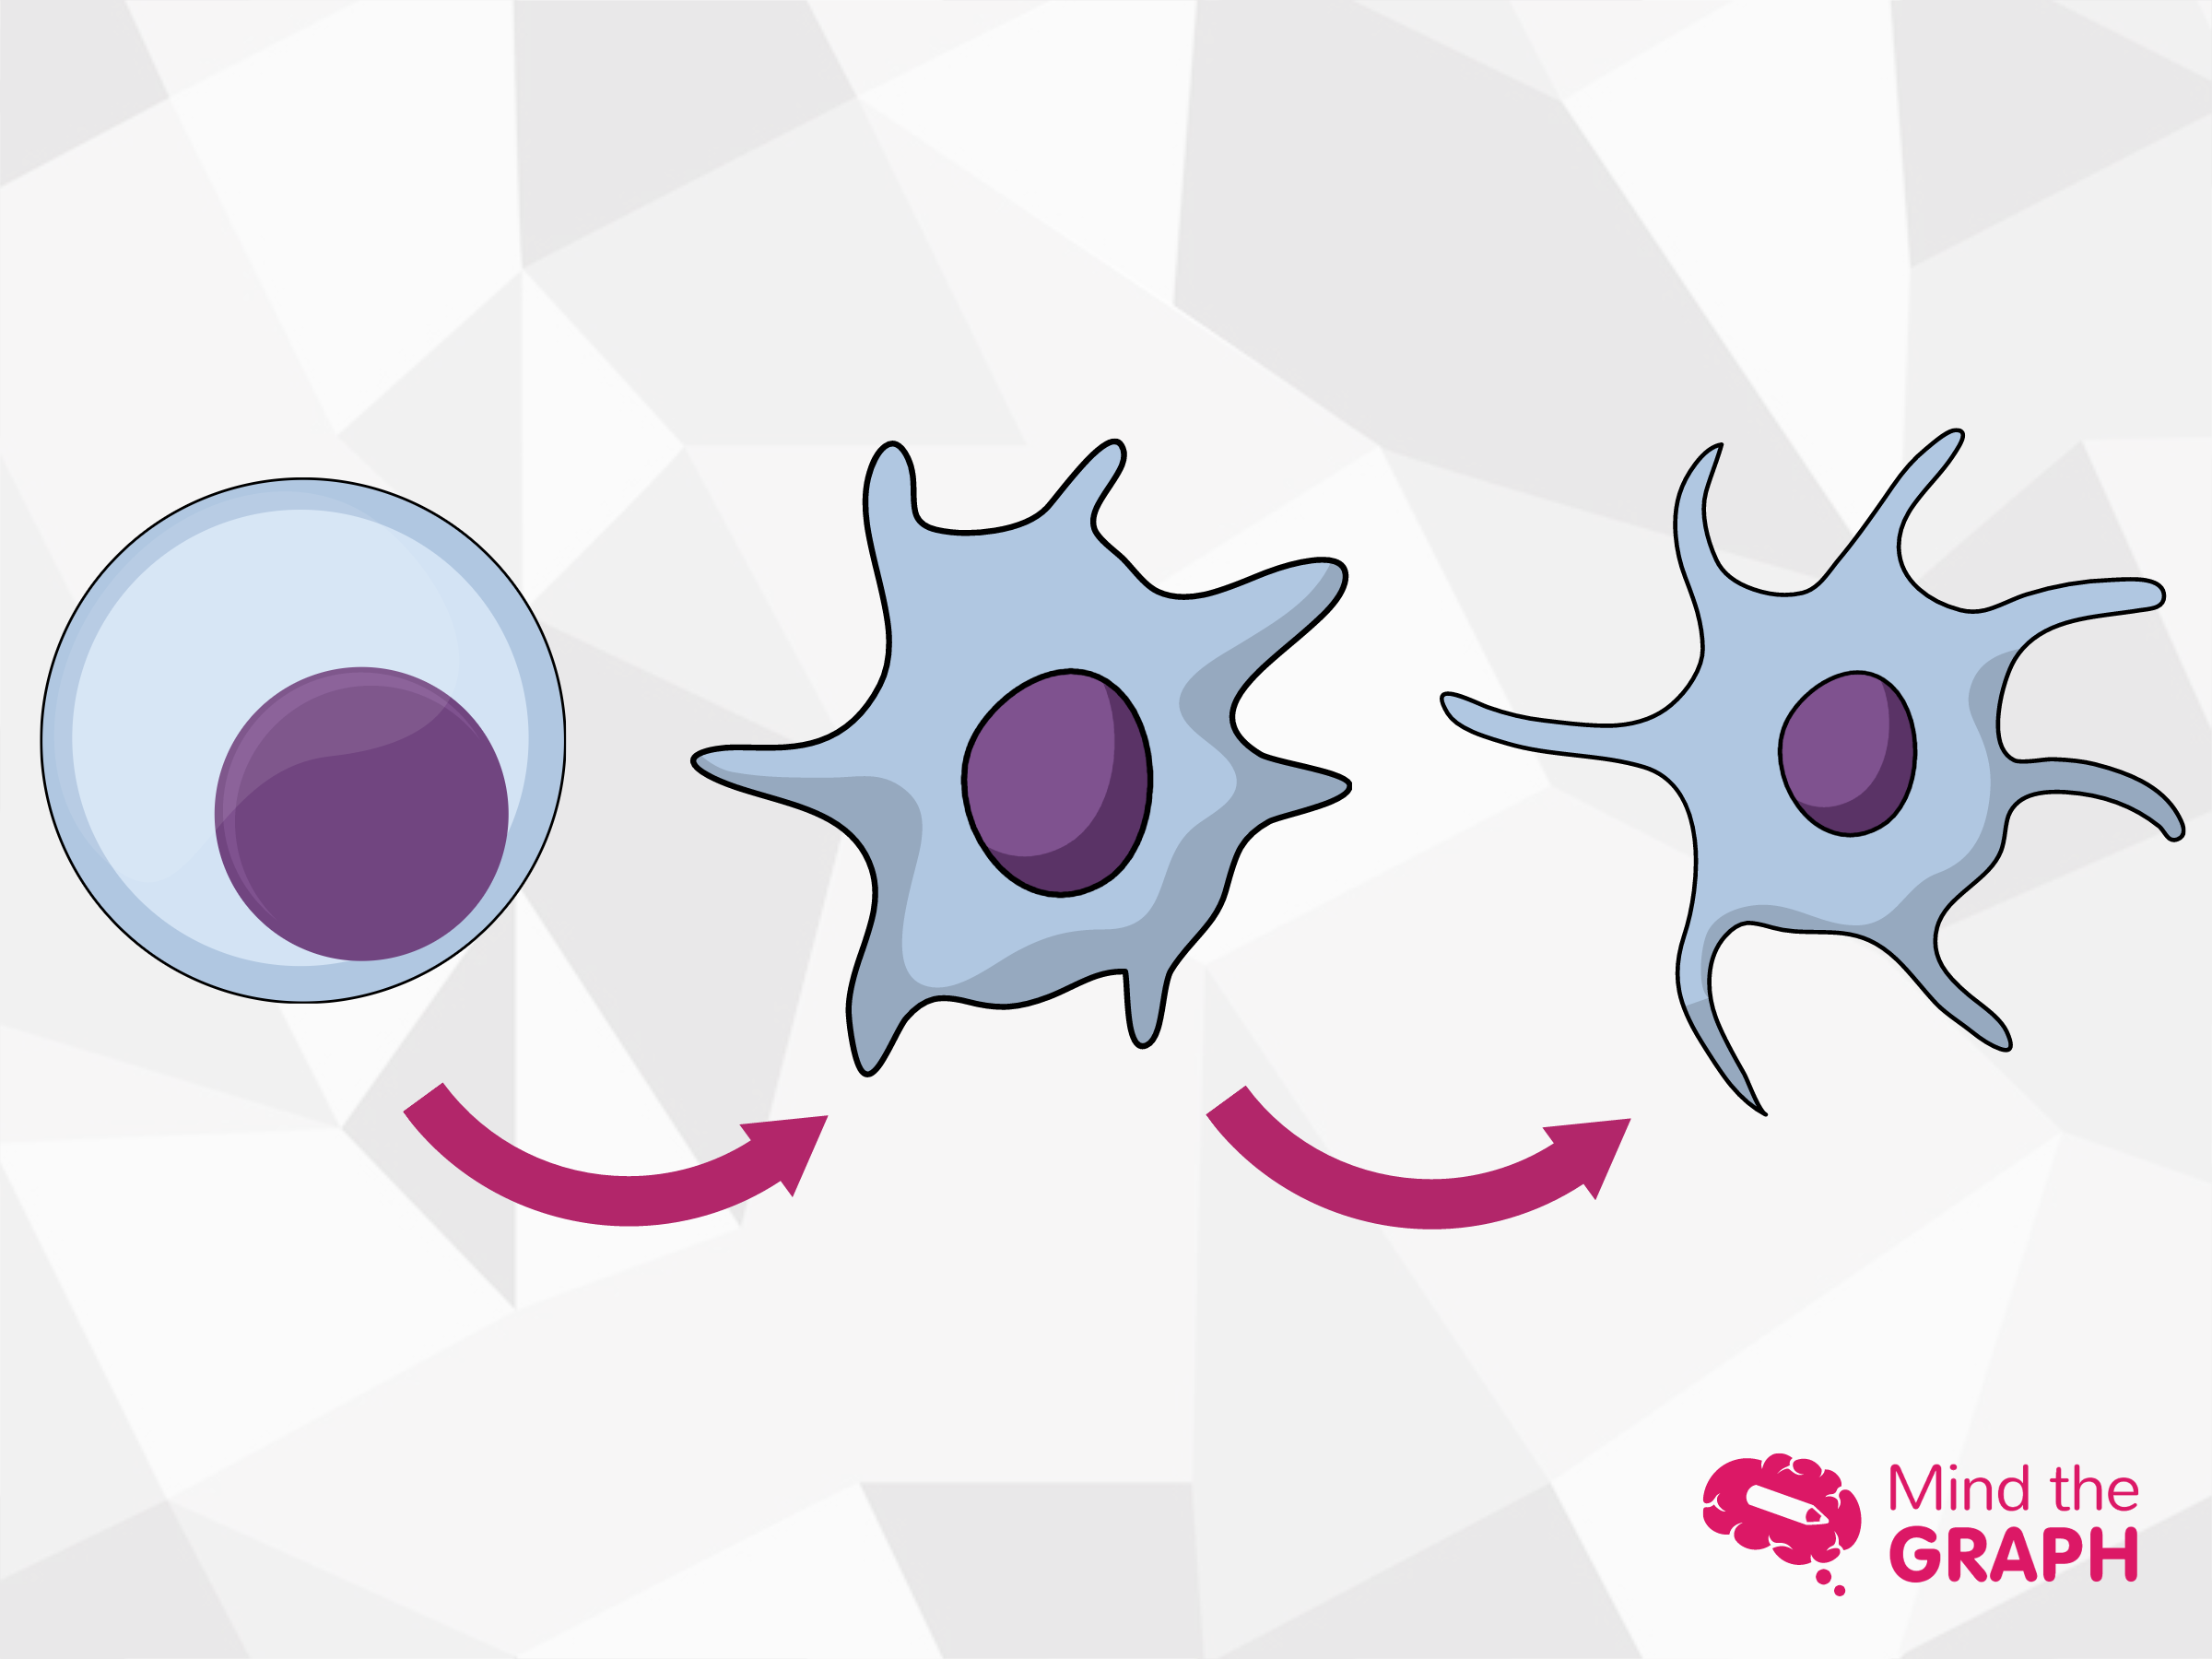
Senescent cells are known for making our bodies age. It is the natural course of […]
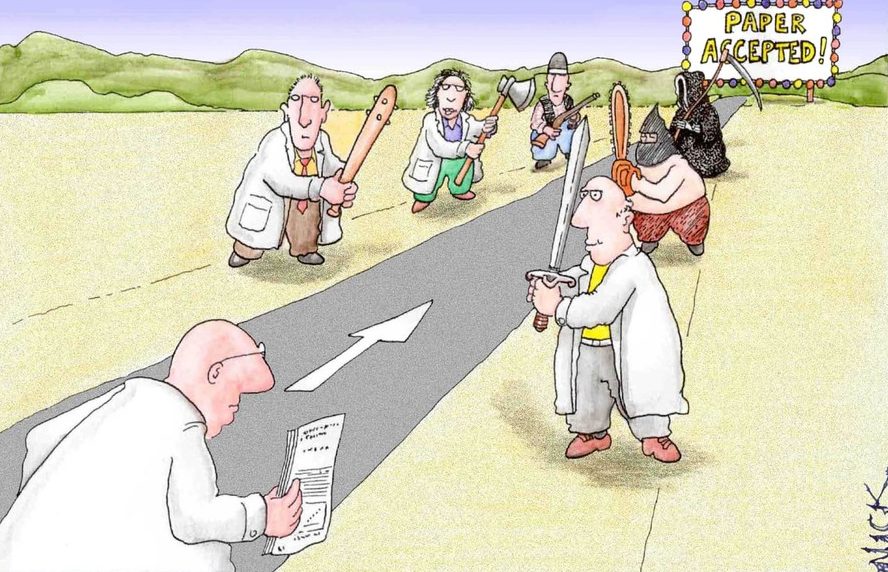
Writing a scientific paper is difficult enough, right? Well, nothing is so bad that can’t […]
The autophagy process is involved in several conditions such as cancer and neurological diseases. It […]
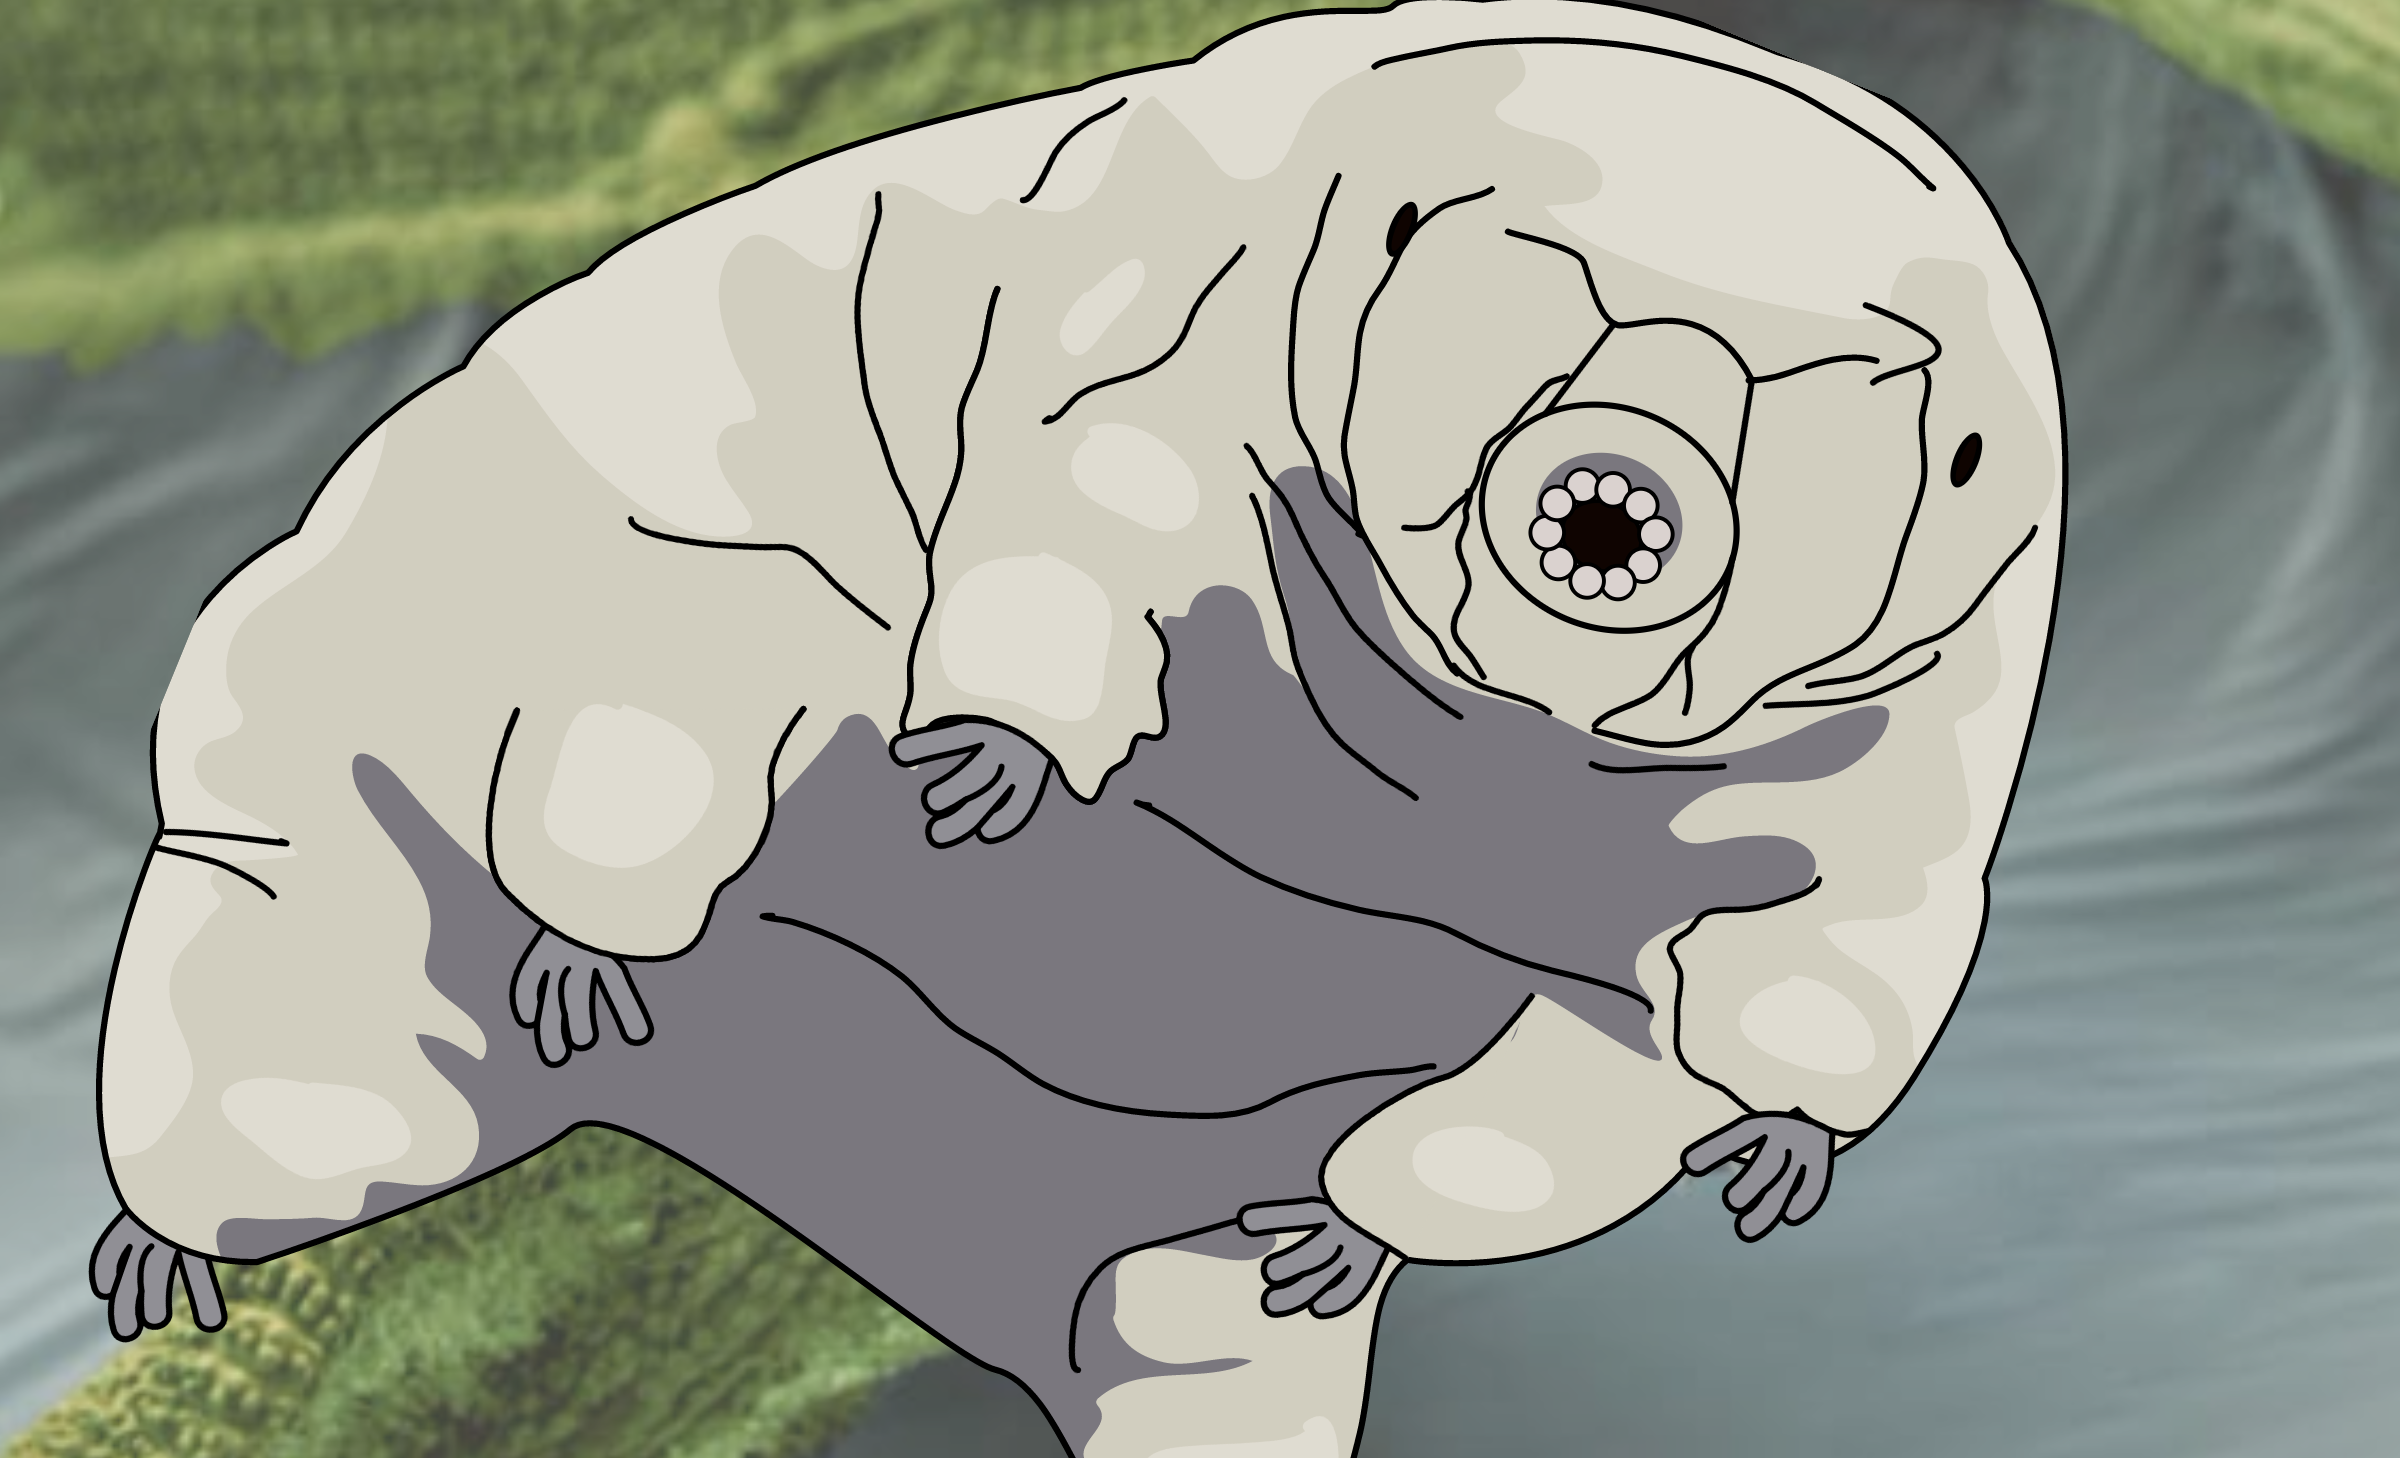
The tartigrades superpowers are a trending topic all around the world. However, just when you […]
To scientists, the beauty in Science can be found in the tiniest particularity of their […]
Sometimes, I receive e-mails from scientists, engineers, teatchers and other professionals saying: Oh, I love […]
Have you ever thought about what is the next step for education? It is a […]
There is no easy part in being a researcher. You must be focused and resilient […]