Sometimes, I receive e-mails from scientists, engineers, teatchers and other professionals saying: Oh, I love Mind the Graph, but is only for life scientists. This is a common mistake. Initially, we focused on biological and medical illustrations, but we are growing and we want possibilite create infographics beyond the life sciences.
So, this post is about a partnership to show how infographics can improve communication in all knowledge areas. For example, how to improve your sales skills?
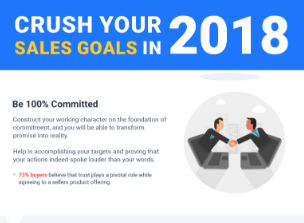
According to Sales mate, the first thing which we should consider to crush sale is to be 100% committed. Prove others that your action speak louder than words. Most of the buyers believe that trust play a vital role to convince your customer. Retain your loyal customer by taking a step forward and guide buyer on tackling certain shortcomings after making a purchase. Most of the buyers need sellers who can who can grow their business by implementing some innovative ideas.
One of the most common thing companies had in their mind is that they think employees are utilizing their time in a proper manner. You can start utilize your time by tracking your time and check where you are spending your time throughout the day. Once you have the layout you can plan which activity to cutoff to be productive. Be a Littlemore skillful by identifying and win the sales opportunities, focusing on account growth and developing consultative sell. Most of the seller collaborate and listen to their buyers.
Sales infographics

To know more, contact Sales Mate. If you want new illustrations in Mind the Graph, write to contact@mindthegraph.com


Subscribe to our newsletter
Exclusive high quality content about effective visual
communication in science.