2 min læsning
08/29/2018
Mind The Graph Scientific Blog er beregnet til at hjælpe forskere med at lære, hvordan man kommunikerer videnskab på en ukompliceret måde.
At udgive en artikel, som ingen nogensinde vil læse, er ikke sjovt. I stedet er det fantastisk at finde ud af, at nogen over hele verden læser og citerer dit arbejde. Men hvordan ved man, hvad der er sket med ens forskning? Hvordan kan man være opmærksom på den effekt, man skaber med sine publikationer? [...]
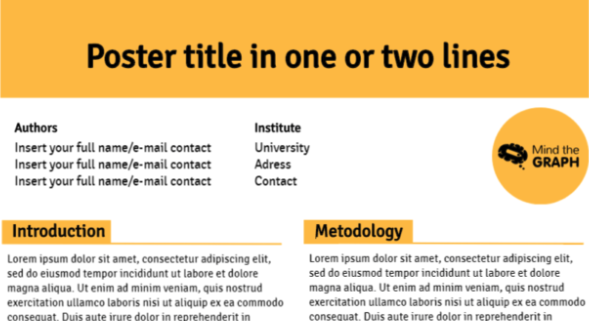
At præsentere en videnskabelig plakat er en almindelig måde at kommunikere videnskabelig forskning på. Det er en [...]
Når alt arbejdet er gjort og gennemgået et par hundrede gange, kommer den så ventede [...]
Hvis du tror, at udgivelse af en artikel er den eneste måde at få synlighed til din [...].
Når emnet er information, er det ingen trend at kombinere figurer og tekster. At kalde det infografik [...]
Alberto Cairo er en reference inden for datavisualisering og et af de største navne, når det gælder [...]
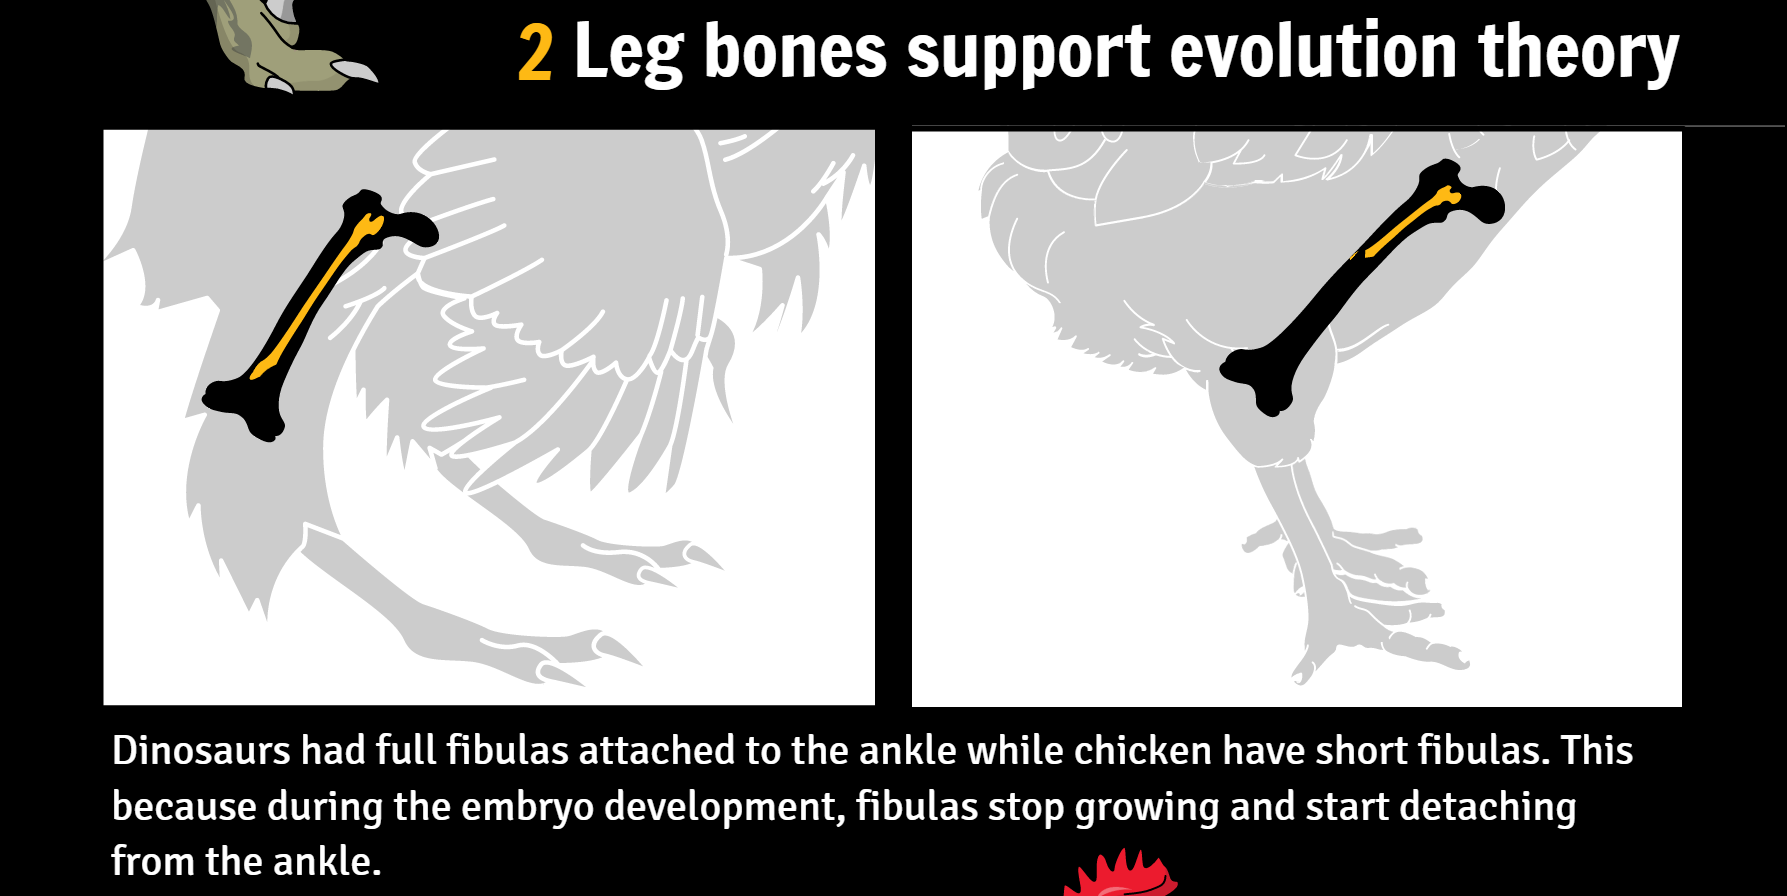
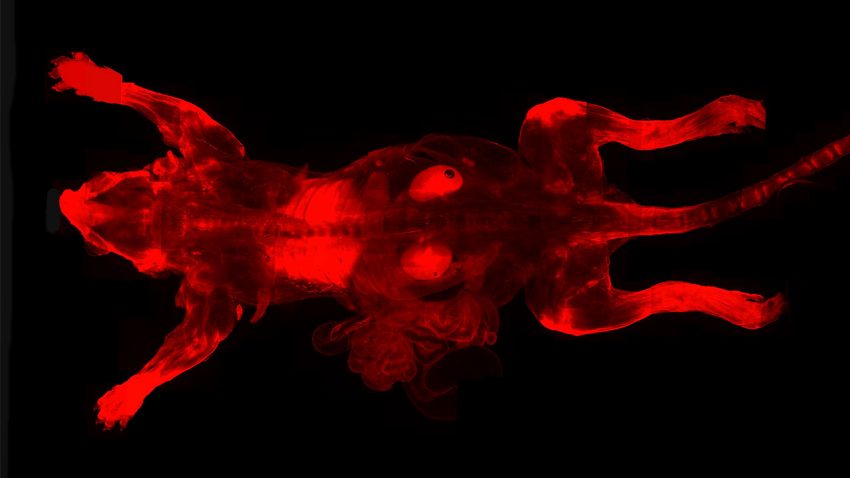
I sidste uge offentliggjorde Botelho et al. en ny undersøgelse af genmanipulation i kyllinger. Deres [...]
Science fiction-film har givet os håb om at udvikle superkræfter som usynlighed, superstyrke [...].
Paris, Frankrig & San Diego, Californien (27. oktober 2016) - AgileBio, en førende global udbyder af [...]
Isaac Newton 45 år - Udgav Philosophiae Naturalis Principia Mathematica (Matematiske principper for [...]
Det er altid en fest, når vi ser vores brugeres fantastiske arbejde. Jeg har allerede skrevet om [...]
At være forsker er ikke nogen let opgave. Selvstændigheden ved at have sit eget arbejde kommer [...]
Det første indtryk, Mind the Graph-brugere får, når de logger ind på vores platform, er: [...]