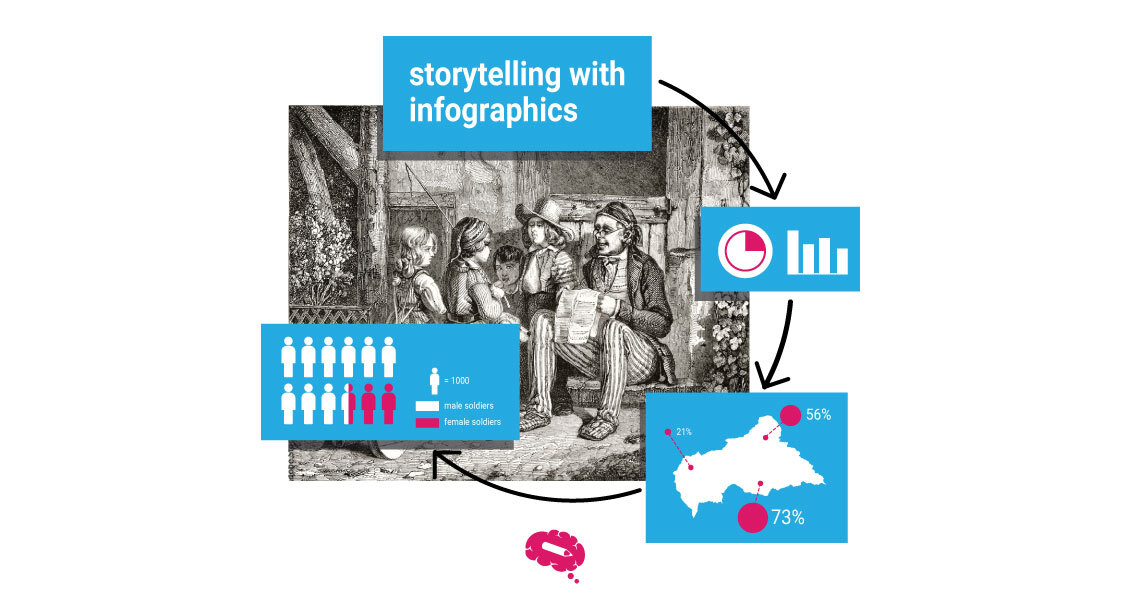
Storytelling With Infographics: The Power Of Visual Narrative
Unleash the power of storytelling with infographics. Learn how to craft visually compelling narratives that engage and inform your audience.
Boost your infographic creations with tutorials and easy design tips, from basic to pro.
Unleash the power of storytelling with infographics. Learn how to craft visually compelling narratives that engage and inform your audience.
Master Scientific Data Visualization. Learn how to make data easier, unlock insights and captivate audiences effectively.
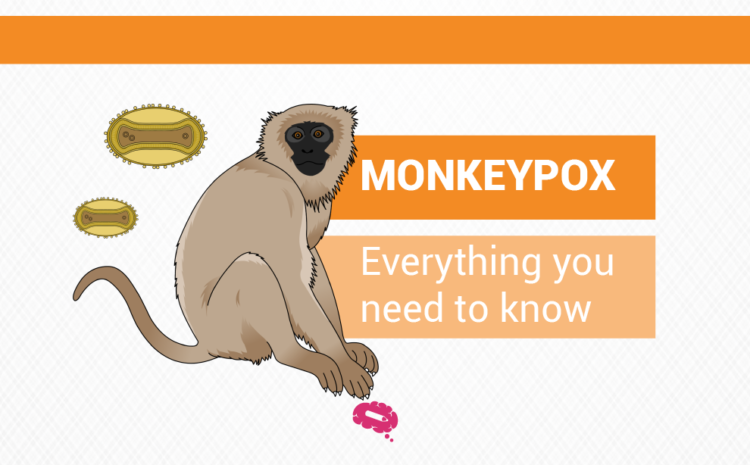
In this article, we take a look at what monkeypox is and how to identify its symptoms and recommend steps to prevent it.
Learn everything you need to know about scientific illustrations, how to make them and their crucial role in science here.
Nature Special Edition Welcome, everyone! Welcome to this very special edition of Mind the Graph […]
What is DMT? DMT, or N, N-dimethyltryptamine, is a natural substance present in the leaves […]
Infographics in Healthcare How many times did you find yourself reading flyers in the waiting […]
If you want to know what science says about cannabis’ bioavailability and P450 cytochrome cannabinoids’ […]
Create the best version of any science figure How to create an infographic? There are […]
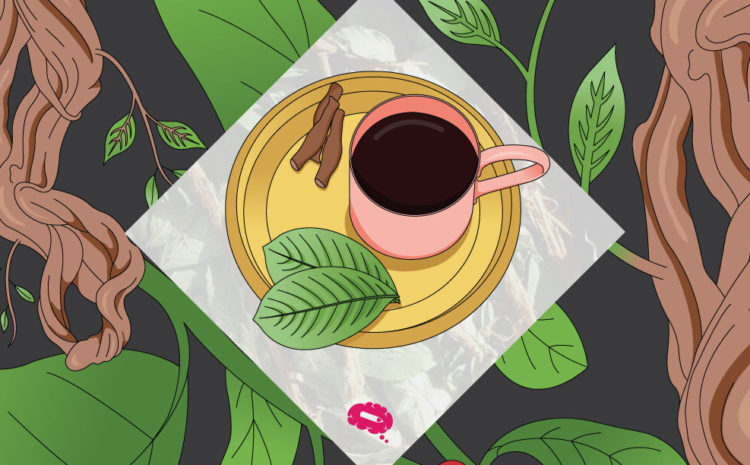
In the last few years, the interest in what is the psychoactive tea Ayahuasca has […]
Regarding creating an infographic there are no rules. Not even an absolute truth. You can […]
Named after the brightest star in the night sky, Sirius is one of the first […]
A great part of the scientist’s routine is to design and perform experiments. The combination […]