Boost your infographic creations with tutorials and easy design tips, from basic to pro.
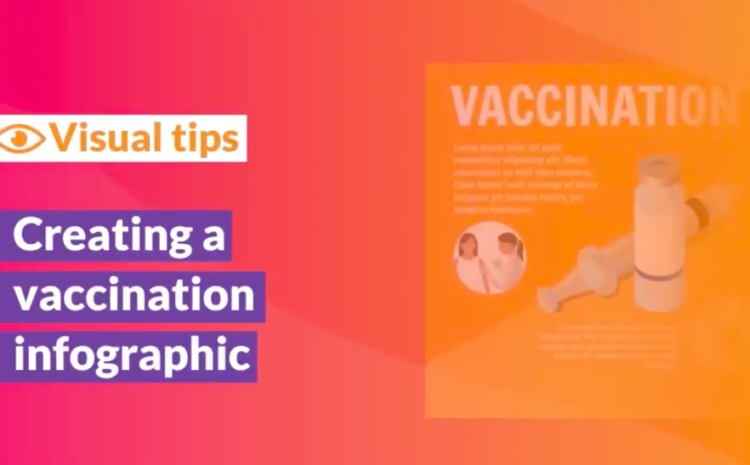
Tutorial on how to create an attractive vaccination infographic with scientific illustrations on Mind the […]
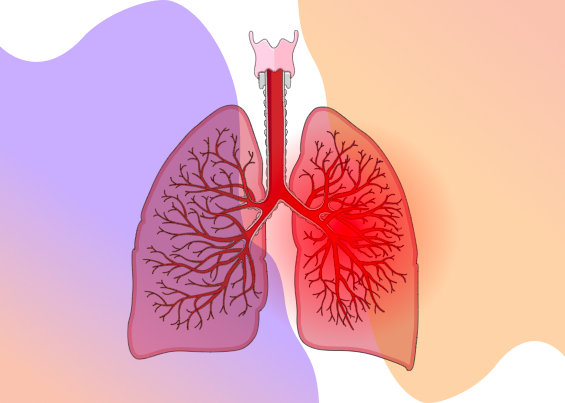
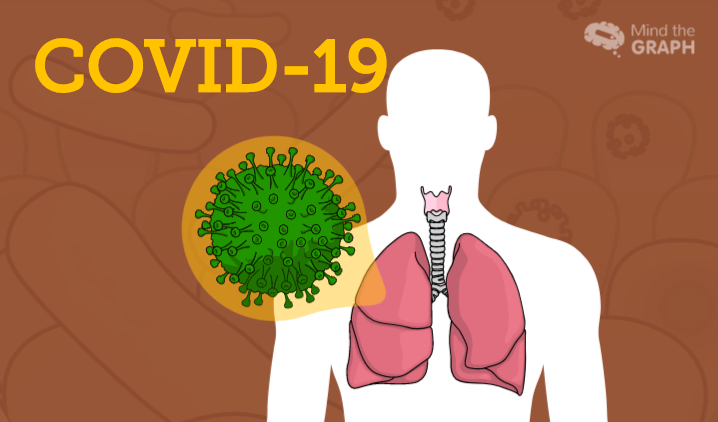
The world is facing a major health crisis. Amid the novel Coronavirus pandemic, the first […]
This is an intriguing question. If you were a detective trying to find the coronavirus […]
Despite the fact that the total number of cases is exactly the same, flattening the […]
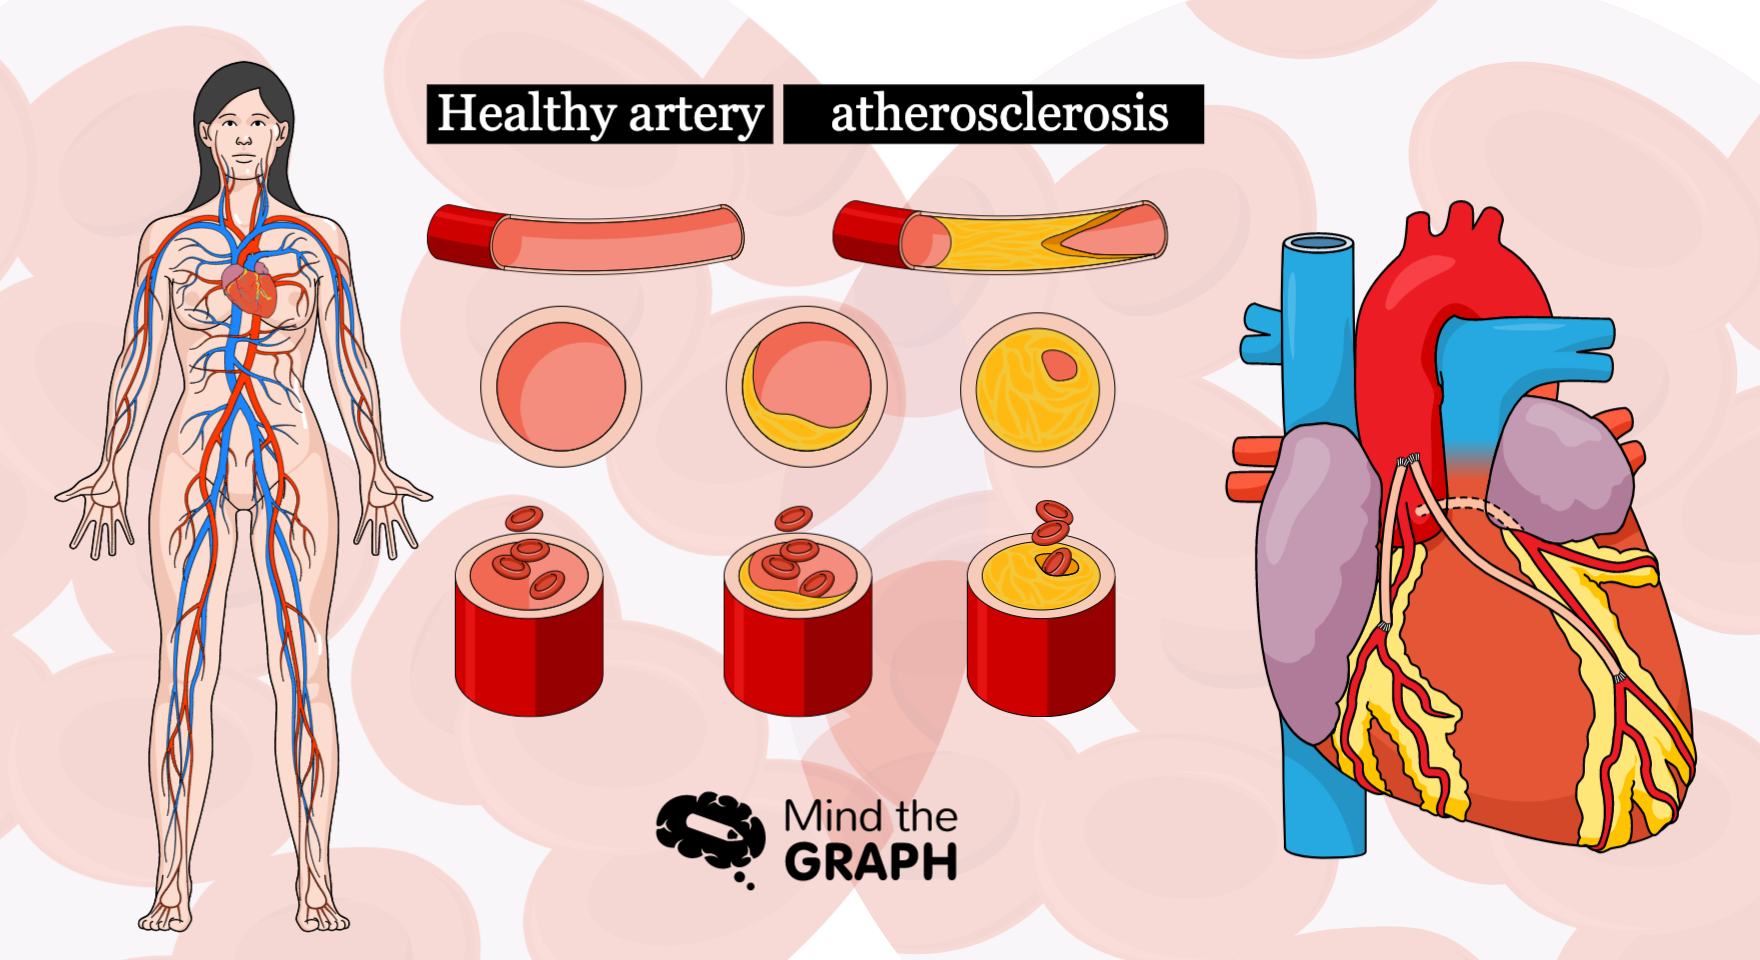
Atherosclerosis is a medical condition of the circulatory system. It happens when plaque accumulate inside […]
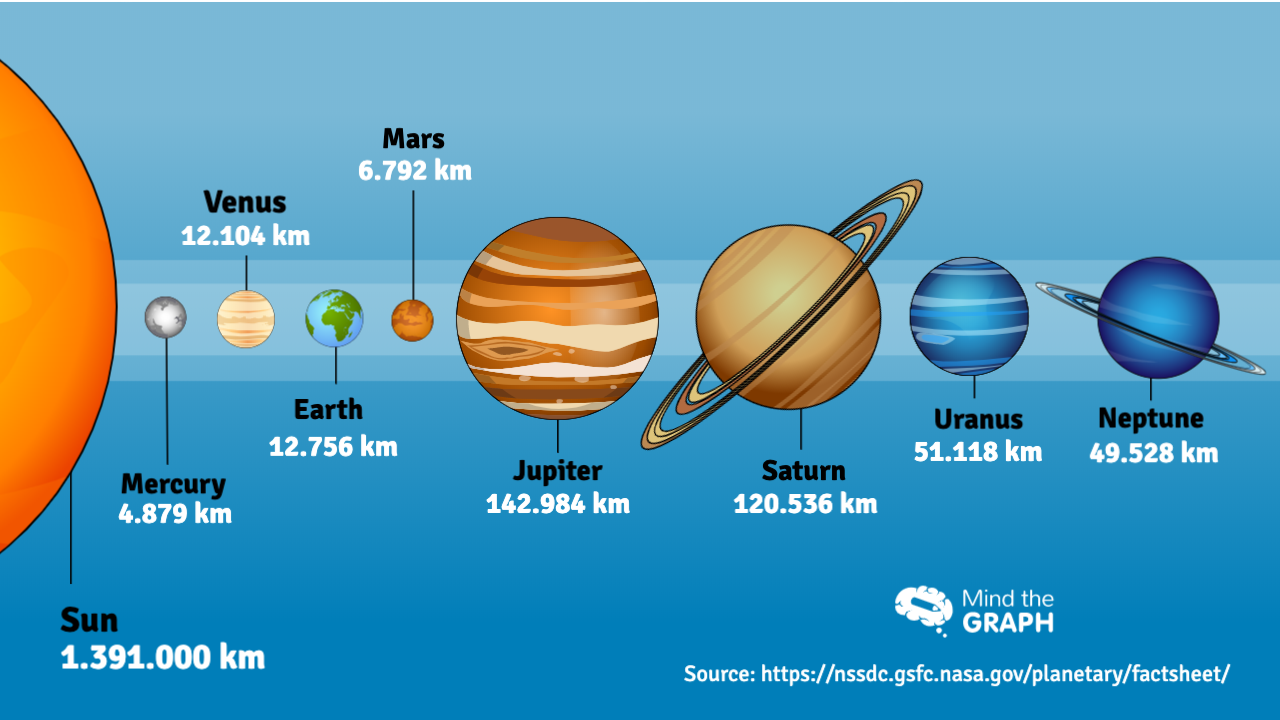
How big and diverse are the universe? Well, this is a tough question even for physics. […]
This post is about a very serious and important topic. Each year nearly 800,000 people […]
To communicate the importance of science in our society, we need first be able to […]
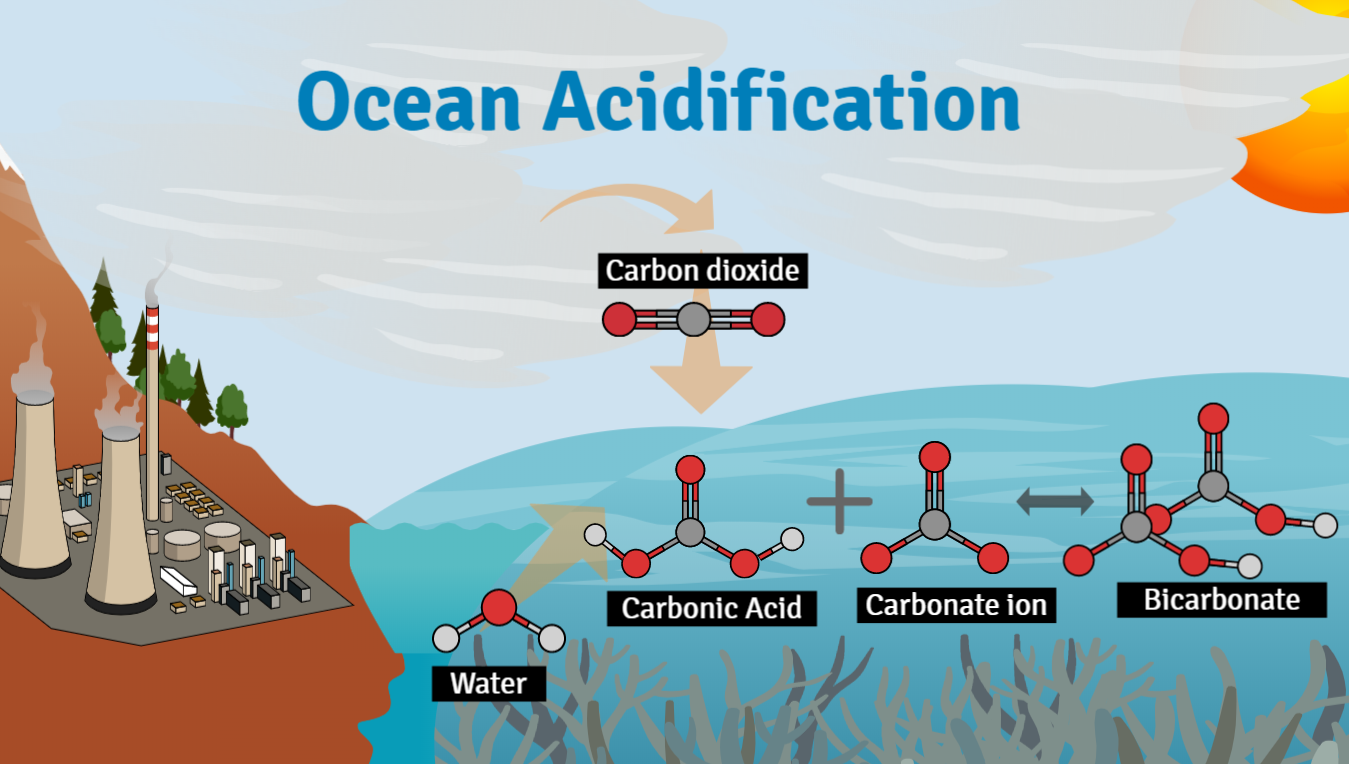
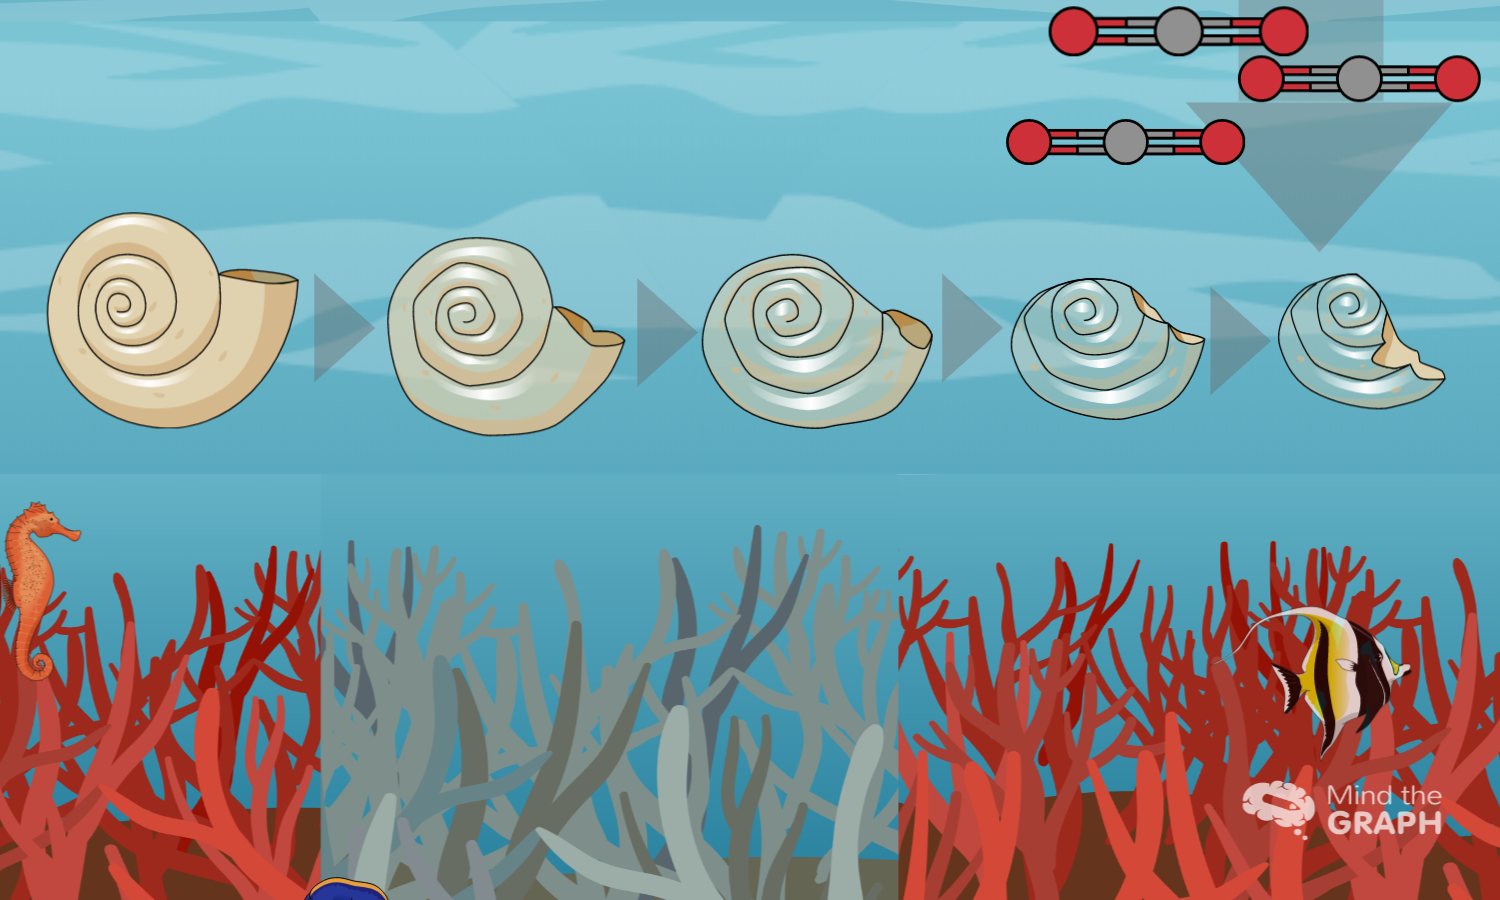
Carbon dioxide is a common gas present in the atmosphere. Normally, the Earth’s carbon cycle […]