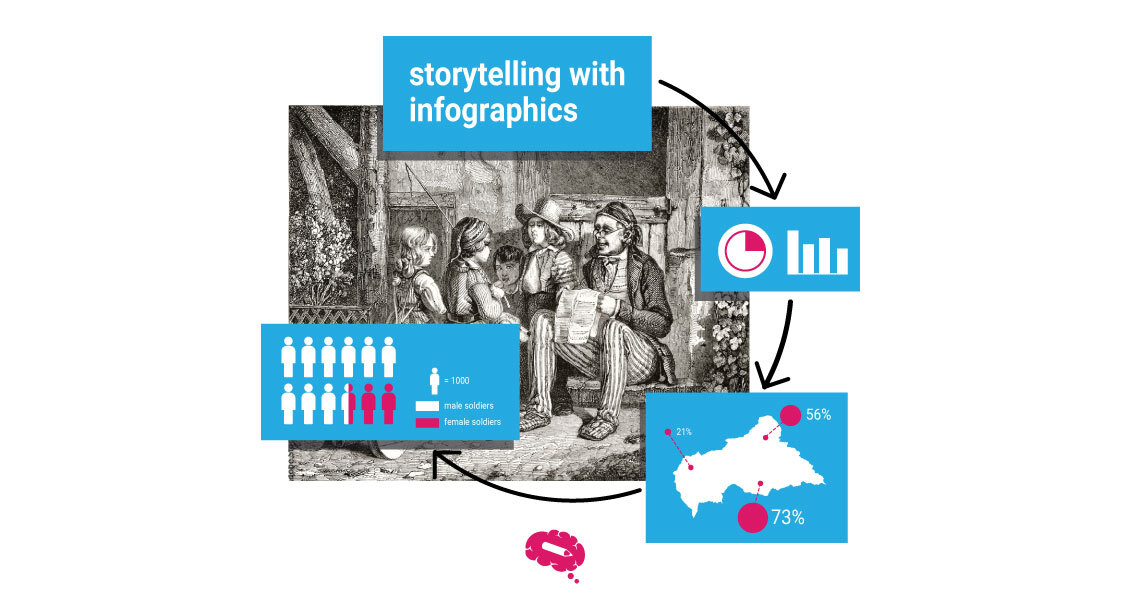
In today’s fast-paced digital world, where information is abundant and attention spans are fleeting, storytelling has emerged as a captivating and effective way to convey ideas. Alongside this, the rise of infographics has revolutionized the visual presentation of data, allowing complex concepts to be communicated with remarkable clarity.
When combined, storytelling and infographics create a dynamic duo that captures attention, enhances understanding, and amplifies impact. Check this strong relationship in the content below:
What Is Storytelling?
Storytelling is a fundamental form of human communication and expression that has been used for centuries to convey information, entertain, educate, and preserve cultural heritage. At its core, storytelling is the art of sharing narratives, whether they are real or fictional, in a structured and engaging manner.
Stories are powerful vehicles that transcend time, culture, and language barriers. They have the ability to captivate and connect with audiences on an emotional level, evoking empathy, curiosity, and a sense of shared experience. Through storytelling, ideas, experiences, and knowledge are communicated and passed down from one generation to another, shaping our understanding of the world.
Storytelling often involves a narrative structure, comprising characters, settings, plotlines, and themes. These elements work together to create a coherent and compelling tale that draws in the listener or reader. Stories can take various forms, including oral traditions, written literature, theater, films, and even digital media.
It educates and teaches valuable lessons, enabling us to learn from the experiences of others. Stories can inspire, motivate, and influence individuals and societies, driving change and shaping beliefs. They can also be employed to persuade, market products or ideas, and build connections with audiences.
What Are Infographics?
Infographics are visual representations of information, data, or knowledge that blend design, illustration, and textual elements to communicate complex ideas in a clear and concise manner. They are created to present information visually, making it easier to understand, remember, and engage with.
Infographics leverage the power of visual communication by combining various graphic elements such as charts, graphs, icons, illustrations, images, and typography. These elements work together to convey information in a visually appealing and organized format, allowing viewers to quickly grasp key messages and insights.
The primary goal of infographics is to transform complex data or concepts into easily digestible and visually appealing narratives. They take raw information, such as statistics, research findings, or processes, and present it in a structured and visually intuitive way. This visual storytelling approach enables viewers to grasp patterns, trends, and relationships more effectively than they would from textual or numerical information alone.
Infographics can be found in a variety of contexts, including news articles, educational materials, reports, presentations, social media posts, and marketing campaigns. They are particularly useful when trying to simplify and clarify intricate information, present comparisons or trends, illustrate step-by-step processes, or showcase data-driven insights.
By utilizing infographics, complex information becomes more accessible, engaging, and memorable. The visual elements create a visual hierarchy, emphasizing key points, and guiding the viewer’s attention. Infographics also allow for customization and creativity, enabling designers to align the visual style with the intended message or brand identity.
Benefits Of Storytelling With Infographics
Storytelling with infographics offers a multitude of benefits that can significantly enhance communication, engagement, and understanding. By combining the power of storytelling with visually compelling graphics, infographics capture attention, simplify complex ideas, create maximum impact, foster communication and interaction, and boost marketing efforts. Let’s explore each of these advantages in detail.
Capture Attention
In a world saturated with information and limited attention spans, capturing and maintaining audience attention is paramount. Infographics excel in this regard by utilizing visually appealing designs, vibrant colors, and engaging narratives. The combination of text, images, and data visualization in infographics creates a visually stimulating experience that immediately grabs attention and entices viewers to explore further.
Easier To Understand Complex Ideas
Infographics have a remarkable ability to distill complex ideas and information into clear and concise visual representations. By presenting data in a visually organized and structured format, infographics break down intricate concepts into easily digestible components. Through the use of charts, graphs, icons, and illustrations, they simplify the understanding of complex data sets, enabling viewers to grasp key insights quickly and effortlessly.
Maximum Impact
The fusion of storytelling and infographics allows for the creation of visually compelling narratives that leave a lasting impact on the audience. By combining emotional appeal with data-driven storytelling, infographics evoke an empathetic response and make information more relatable. The strategic use of visuals and narratives in infographics taps into the cognitive and emotional aspects of human perception, resulting in a deeper and more memorable experience for viewers.
Enhances Communication And Interaction
Infographics facilitate effective communication by providing a visually rich medium for sharing information. They enable complex ideas to be communicated in a concise and visually appealing manner, making it easier for audiences to understand and retain information. Infographics also foster interaction and engagement, as viewers are more likely to share, discuss, and respond to visually compelling content. They can be shared across various platforms, including websites, social media, and presentations, enabling broader reach and encouraging dialogue.
Boosts Marketing Efforts And Engagement
Storytelling with infographics has proven to be a powerful tool for marketers. Infographics offer a visually captivating and shareable format that attracts attention and drives engagement. They effectively convey brand messages, promote products or services, and communicate complex information about a company or industry. Infographics can be utilized in digital marketing campaigns, social media posts, blog articles, and presentations, amplifying reach, increasing brand visibility, and generating higher levels of audience engagement.
Challenges Of Creating Effective Infographics
While storytelling with infographics offers numerous benefits, there are also several challenges that creators face in crafting effective and impactful visual narratives. These challenges include attention spans and time constraints, crafting the right message, finding the appropriate visual elements, and addressing human resource management issues. Understanding these challenges is crucial for overcoming them and creating compelling infographics that resonate with audiences. Let’s explore each of these challenges in detail.
Attention Spans And Time Constraints
Capturing and maintaining audience attention is increasingly difficult. Viewers have limited attention spans and often skim through content quickly. Infographics need to grab attention within seconds and convey information concisely. Overcoming these attention constraints requires careful consideration of design, layout, and content organization to ensure that the most important information is presented prominently and in a visually engaging manner.
Crafting The Right Message That Resonates With Audience
Crafting a message that connects with the target audience is essential for effective storytelling with infographics. Understanding the audience’s needs, interests, and preferences is crucial in tailoring the narrative to resonate with them. It involves conducting audience research, identifying their pain points, and aligning the infographic’s message with their expectations. Crafting a compelling narrative that speaks to the audience requires thoughtful planning, research, and understanding of their motivations and desires.
Finding The Right Visual Elements For A Powerful Story
Choosing the right visual elements is vital for creating impactful infographics. Visuals such as icons, illustrations, charts, and images play a significant role in conveying information and enhancing the narrative. However, finding the appropriate visual elements that effectively communicate the story can be challenging. It requires a balance between aesthetics, functionality, and relevance. Designers need to carefully select visuals that align with the message, reinforce the storytelling, and enhance the overall impact of the infographic.
Addressing Human Resource Management Issues
Creating effective infographics often involves collaboration among a team of designers, writers, and data analysts. Ensuring efficient communication, coordination, and resource allocation within the team can be a challenge. Time constraints, differing perspectives, and varying skill sets can impact the collaborative process. Managing human resources effectively, assigning clear roles and responsibilities, and maintaining a cohesive workflow are essential to address these challenges and create cohesive and successful storytelling infographics.
Tips For Creating Successful Storytelling Infographics
Keep It Simple: Use Fewer Words And More Images
When crafting a storytelling infographic, aim for simplicity. Use concise and impactful language to convey your message. Focus on visual elements such as images, icons, and charts to enhance the narrative. Keep text minimal, using it strategically to provide context and guide the viewer’s understanding.
Plan And Outline Your Story
Before diving into the design process, outline the story you want to tell through your infographic. Identify the key points, main message, and the narrative structure. Create a logical flow that guides the viewer from one piece of information to the next, ensuring coherence and clarity.
Know Your Audience
Understanding your target audience is crucial for effective storytelling. Research their demographics, interests, and needs. Tailor your infographic’s content, tone, and visual style to resonate with your audience. Consider what will capture their attention and engage them the most.
Utilize Data Visualization
Infographics are excellent tools for presenting data in a visually engaging manner. Incorporate charts, graphs, and diagrams to communicate complex information. Choose the appropriate visualization type that best represents your data and supports the narrative. Ensure that the visualizations are easy to understand and interpret.
Create A Strong Visual Hierarchy
Design your infographic with a clear visual hierarchy that guides the viewer’s attention. Use size, color, and placement strategically to highlight important elements. Ensure that the most crucial information stands out and is easily discernible. Maintain consistency in the visual hierarchy throughout the infographic.
Tell A Compelling Story
Remember that storytelling is at the heart of your infographic. Develop a compelling narrative that evokes emotion and connects with the viewer. Create a beginning, middle, and end, building anticipation and leading to a satisfying conclusion. Use storytelling techniques such as conflict, resolution, and character development to engage the audience.
Design With Consistency And Visual Appeal
Pay attention to the overall design aesthetics of your infographic. Use a consistent color scheme, typography, and visual style to maintain a cohesive look. Ensure that the design is visually appealing, incorporating balance, harmony, and appropriate use of white space. Make your infographic visually enticing to encourage engagement.
Test And Iterate
Before finalizing your storytelling infographic, test it with a sample audience or gather feedback from colleagues. Pay attention to their understanding, engagement, and suggestions. Iterate on your design, making improvements and refinements based on the feedback received. Aim for continuous improvement and enhancement.
Optimize For Different Platforms
Take into account the platforms on which you plan to share your infographic. Adapt the size, format, and orientation of your infographic accordingly. Ensure that it is optimized for web, mobile, and social media platforms. Keep file sizes manageable without compromising the visual quality.
Exclusive Scientific Content, Curated By Scientists
Elevate your scientific communication with Mind the Graph, the game-changing platform designed by scientists for scientists. With an exclusive library of accurate illustrations and templates, you can effortlessly create visually stunning graphics. Experience the power of Mind the Graph and revolutionize how you communicate your research findings and scientific concepts.


Subscribe to our newsletter
Exclusive high quality content about effective visual
communication in science.