How to make an infographic #2 – Show your data in an awesome way!
How to make an infographic series This is the second post of the series How […]
This category contains all you need to know about science design for research papers.
How to make an infographic series This is the second post of the series How […]
Discover how to make an infographic Communication is an important part of scientific life. And […]
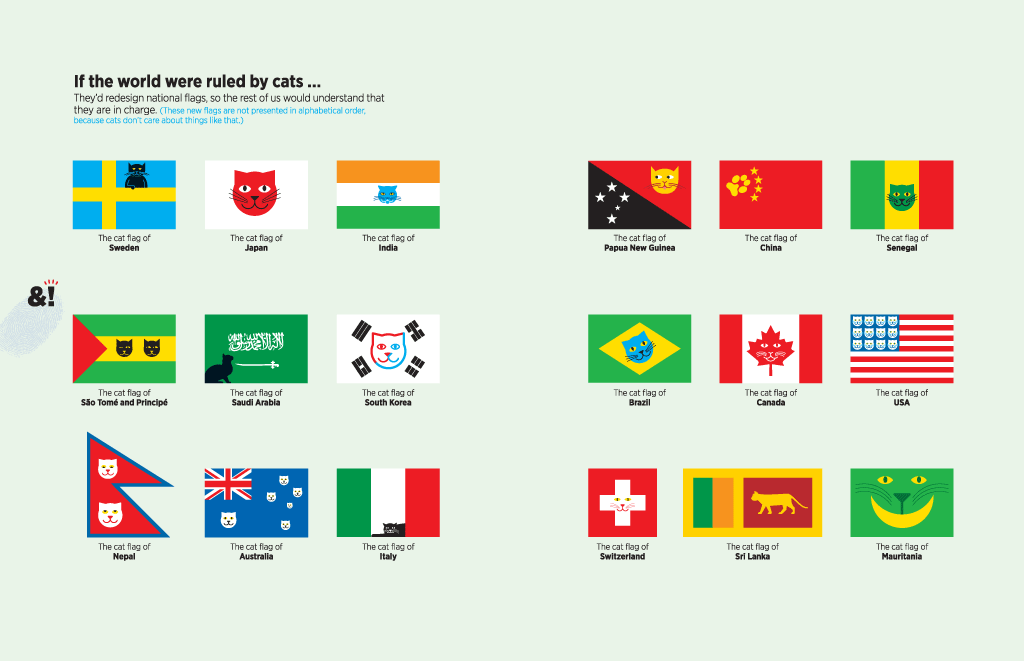
Sometimes, being a scientist means experience unusual or funny situations during work. The routine of […]
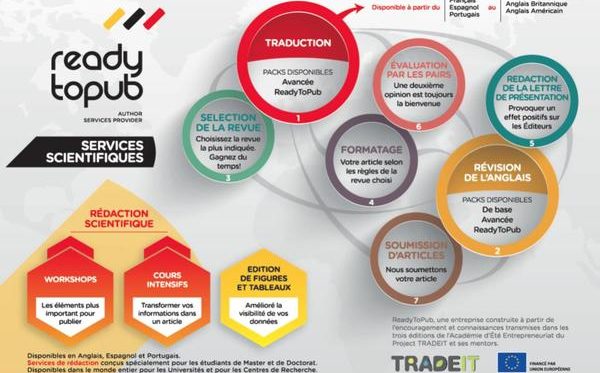
Recentemente, ReadyToPub e Mind the Graph, avançaram com a inclusão da plataforma Mind the Graph […]
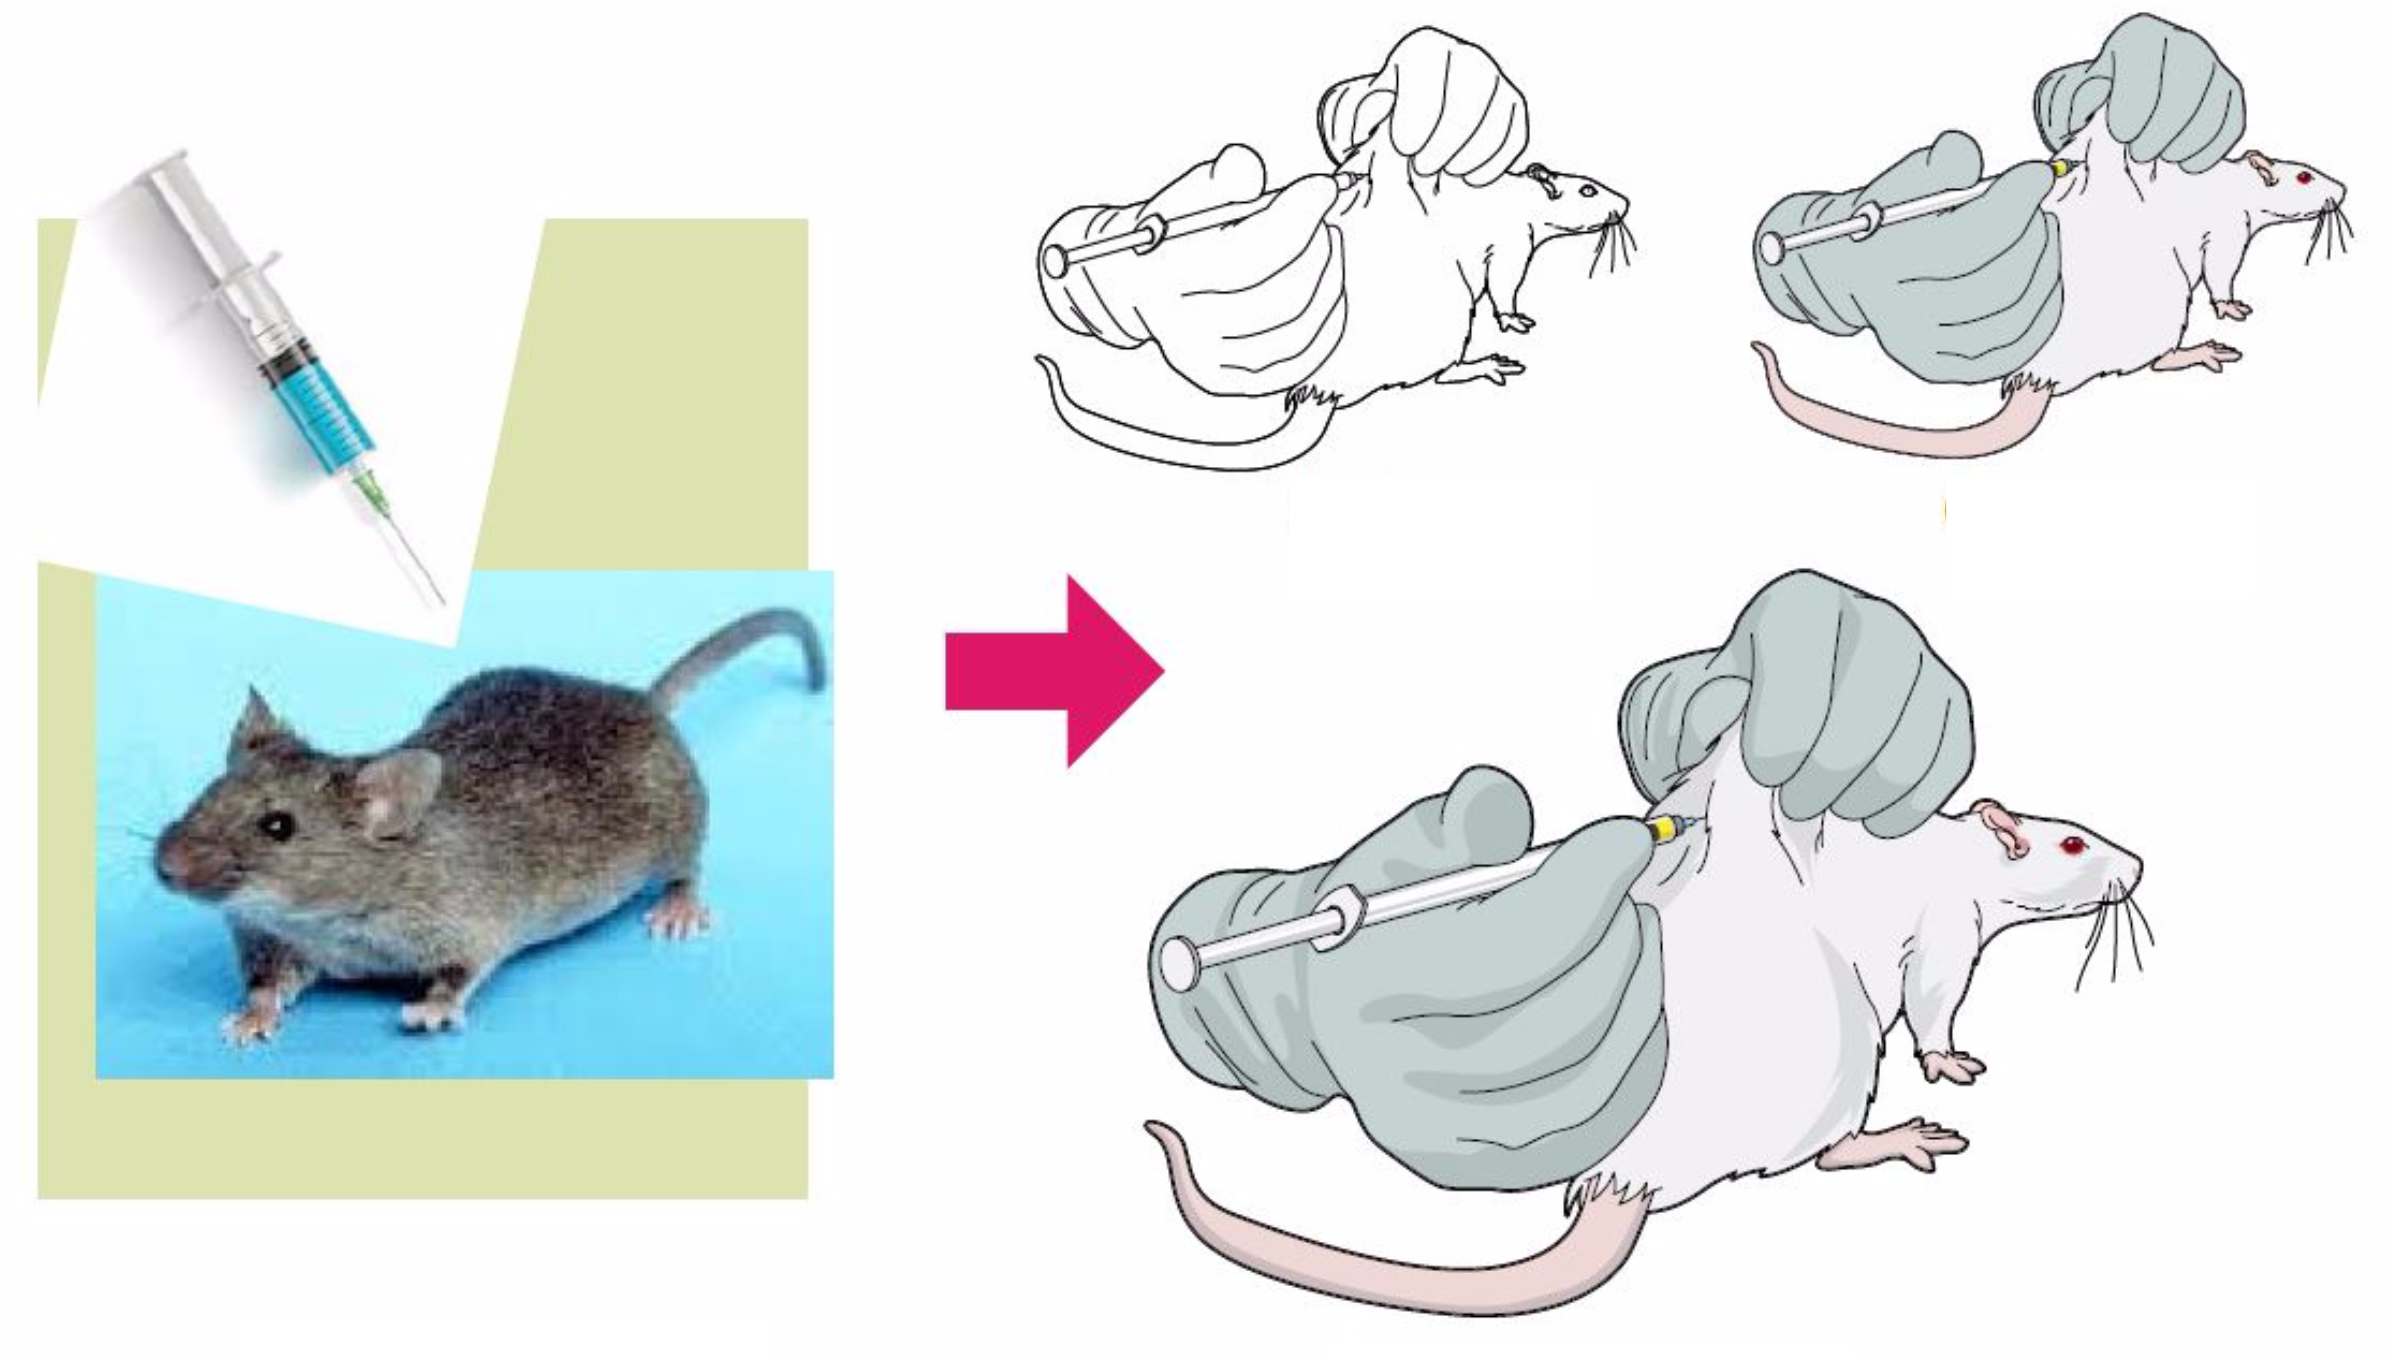
Quite often scientists and researchers need a little hand to make graphical abstracts. Some of […]
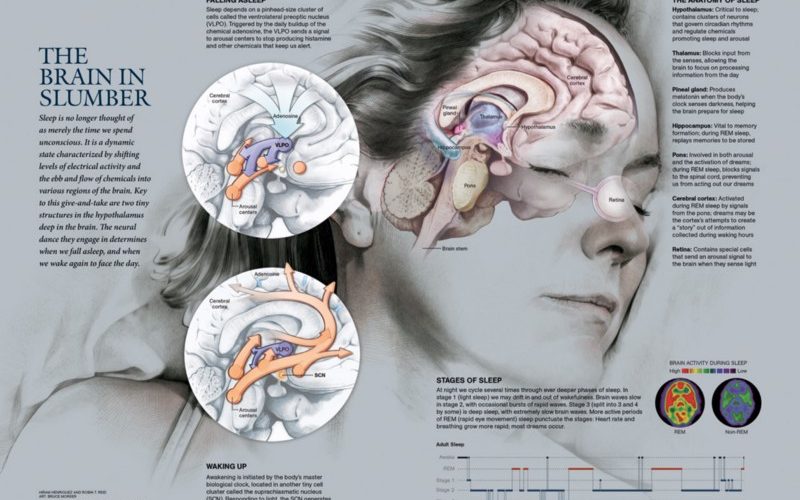
Once upon a time, National Geographic decided to transform information into the best infographics you […]
Want to get visibility for your research but don’t know how? Well, indeed it can […]
When it comes to visual information, there is a deadlock: some people have a hard […]
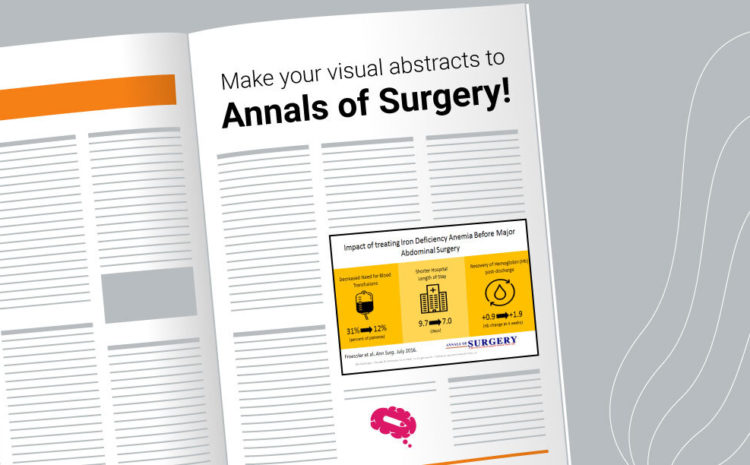
The Annals of Surgery, the world most referenced surgery journal, is now working with visual […]
A scientific presentation is the most ordinary way in Science to show our discoveries. Also, […]
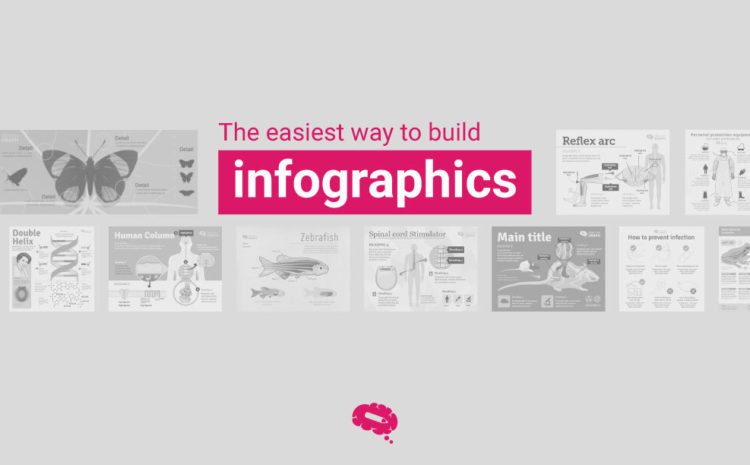
Build Infographics Ok, so you want to build infographics. You already know Mind the Graph. […]
What if all scientific information in the world could be translated into something easier to […]
Hallo, wissenschafts liebhaber! This week Mind the Graph is in Germany and a german blog […]