Dette er det fjerde innlegget i serien Hvordan lage en infografikk. Hvis du gikk glipp av det forrige innlegget, kan du Les den her.
Now we already know the importance of sketching. The first version is always different from the final version. So, start working and make the first draft. Visualization is important for new insights.
Husk hovedspørsmålet i infografikken din. Du må fremheve det.
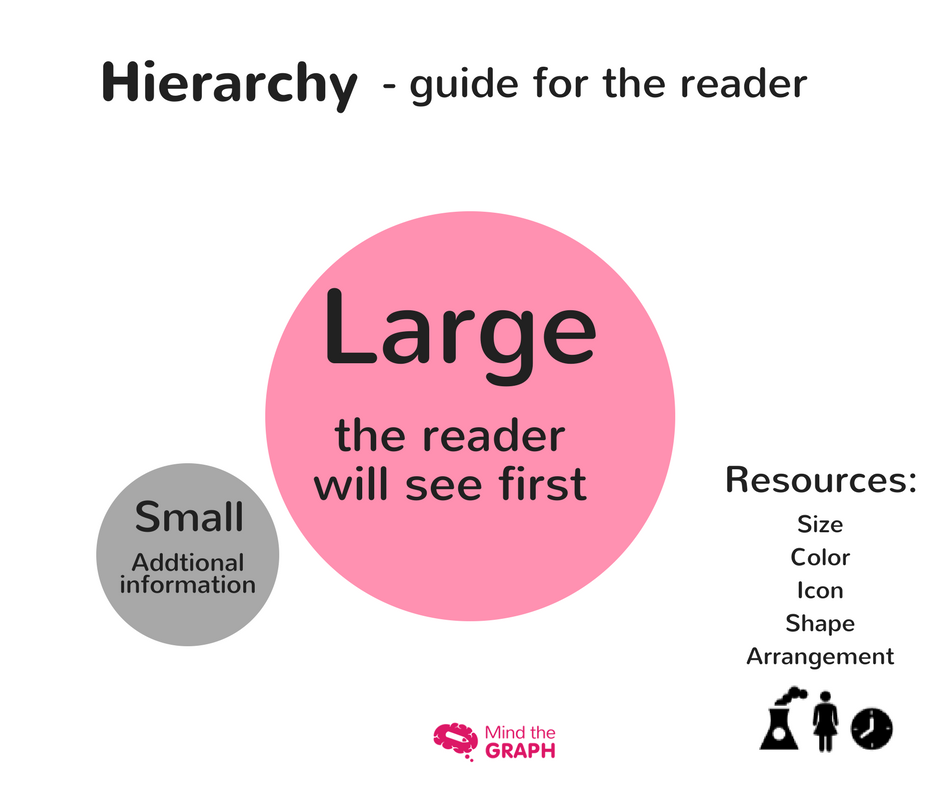
You should structure the layout to create a natural information flow, with highlighted information that the reader will see first, even from a distance, such as title and main image. The more secondary information should be less prominent in order not to pollute the view and take priority.
For å skape et hierarki av elementer kan du redigere farger, størrelse og skrifttyper.
Valg av farger
Infografikkens farger bør passe sammen med alle elementene. Velg en palett og kombiner stiler. Du kan bruke komplementærfarger eller monokrome toner.
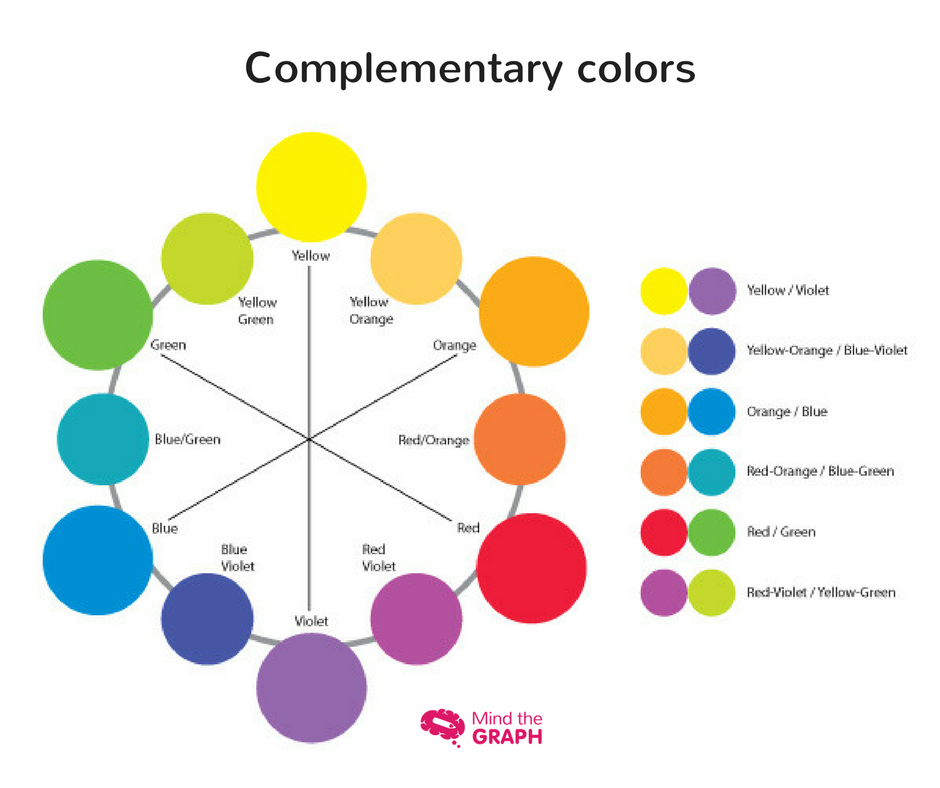

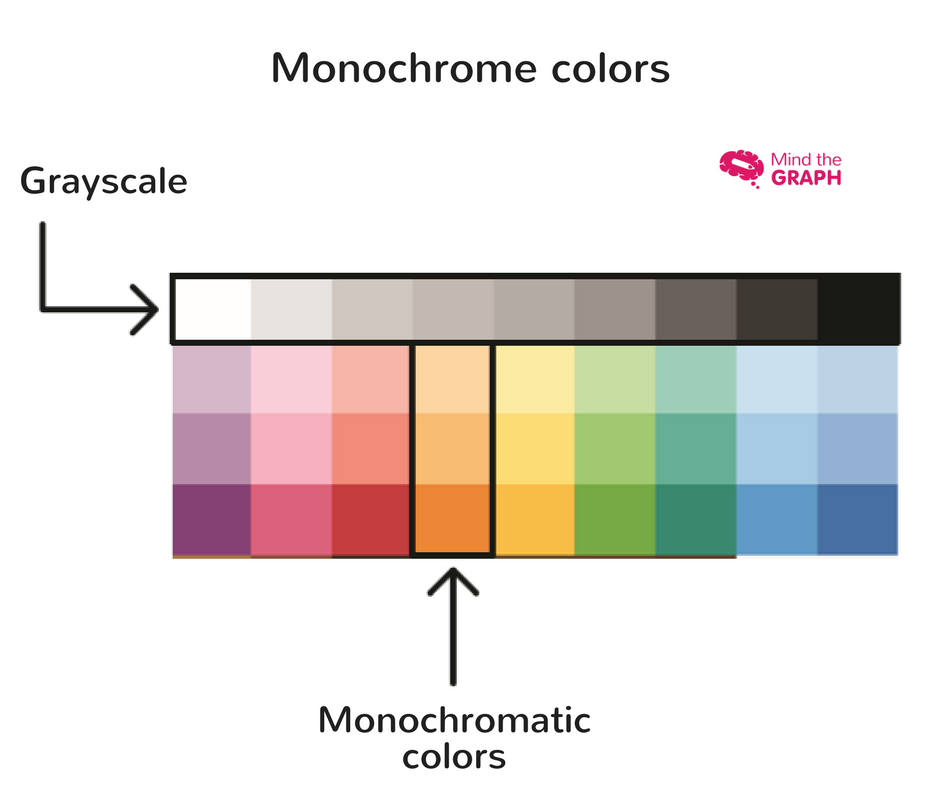
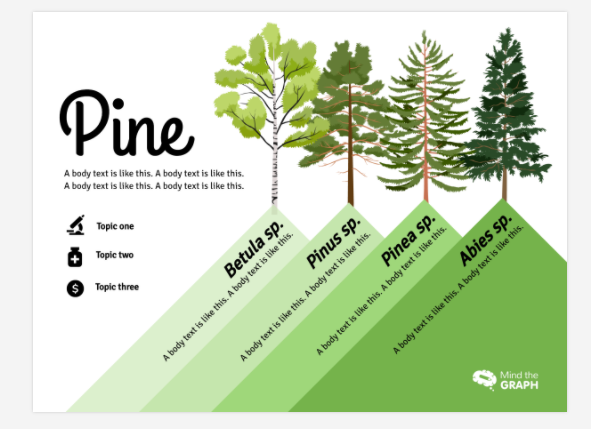
Use color to highlight important information or to group related elements. In this Mind the Graph template, the highlight information is the colors of the spiders. Therefore, all the infographic is in grayscale to not compete with the main data.

Hvis du vil vite mer om hvordan du bruker farger og illustrasjoner, kan du se videoen som designerne våre har laget for å hjelpe deg. Klikk på knappen nedenfor og se den nå:
Hvordan lage en infografikk med fantastiske illustrasjoner?
Et bilde sier mer enn tusen ord.
The illustrations are easier to understand and catch the reader’s attention. But, it is not easy to find stunning images to use in presentations, graphical abstracts, mainly scientific illustrations. It is not enough to use images, you need quality images, scientifically accurate, beautiful and that combine with your infographic design. A beautiful and professional creation makes a lot of difference in the bottom line.

In our platform you’ll find thousands illustrations of science in general. But, if you don’t find the illustrations you need, you can request them. As a Mind the Graph subscriber, you can request as many illustrations you need, all that for a few dollars a month. Hvis du allerede er abonnent og ønsker å bestille en illustrasjon, kan du skrive til contact@mindthegraph.com. Jeg ser frem til at du tar kontakt!
Innleggsserie av Mind the Graph
- Stilling #1 - Kommunikasjon i naturvitenskap
- Post #2 - Gjør dataene dine fantastiske
- Post #3 - Den riktige typen diagram
- Post #4 - La oss snakke om farger!
- Post #5 - Mindre er mer: minimalistisk infografikkdesign
- Post #6 - Feil man bør unngå i forskningskommunikasjon
- Post #7 - En snarvei til å få det gjort
The posts are a guide, made by our designers. They make the amazing illustrations and templates you see on our platform. Also, you can get for free our ebook. Lær hvordan du lager vitenskapelig infografikk og forbedrer presentasjonene dine.

Abonner på nyhetsbrevet vårt
Eksklusivt innhold av høy kvalitet om effektiv visuell
kommunikasjon innen vitenskap.

