Presenting information in visual assets aids readers in efficiently and effectively digesting complex subjects; this involves both graphical abstracts and infographics. Infographics have been used to instruct a huge audience on social media and other digital platforms.
Furthermore, graphical abstracts, which are visual representations of a research paper’s written abstract, are increasingly being utilized to promote new research findings in a wide range of fields.
The emphasis here is not on the rivalry between these two types, but on the usefulness of each format and, as a result, the design distinctions that must be applied in building each of these effective visual communicator tools.
What are graphical abstracts?
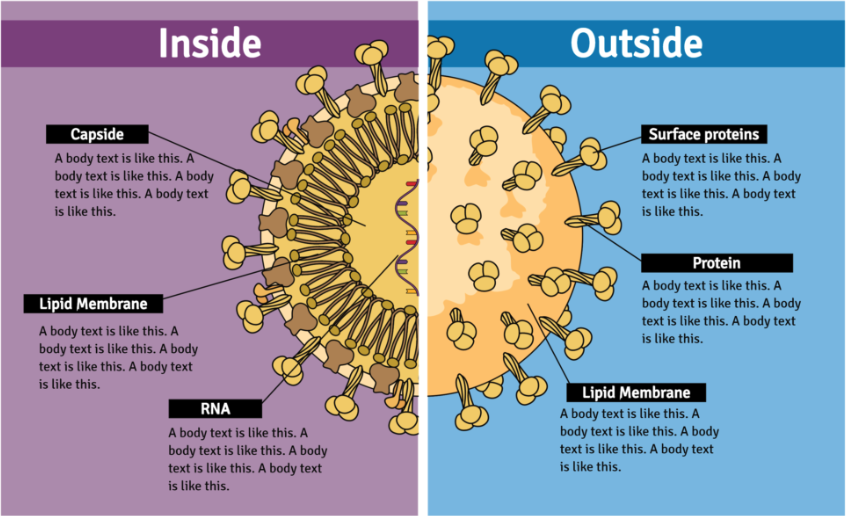
A graphical abstract is a single panel illustration meant to provide readers with quick comprehension of the scientific paper’s main point; they are typically used on social media and journal websites.
There are a variety of opinions on what information should be included in a graphical abstract. Some experts advice including all of the textual abstract, such as background information, the issue the study is aiming to address, the research’s results, conclusions, and ramifications, and maybe even the methodology used.
Unfortunately, because they are not found in scientific literature search engines, they cannot be expected to replace a textual abstract. Therefore, keep in mind that your graphical abstract should accompany, not replace, your written abstract.
Tips on choosing a graphical abstract
- Check the guidelines: If you are submitting your research for publication, remember to check their graphical abstract standards.
- Summarize your significant findings: The purpose of using a graphical abstract is to summarize the outcome of your research concisely.
- Use key phrases or keywords: Because you shouldn’t include too much text in your graphical abstract, consider adding key phrases and keywords to increase readability.
Read our article “How to Create an Effective Graphical Abstract” to understand the fundamentals of creating an outstanding graphical abstract for your research.
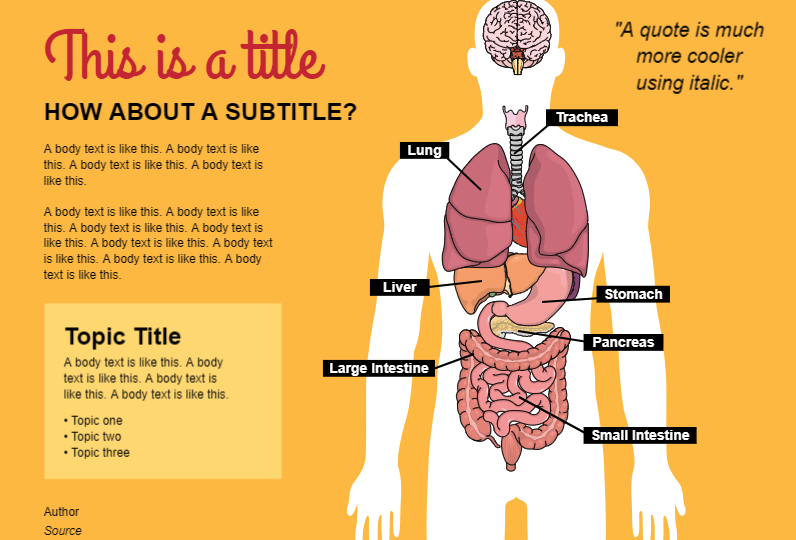
What are infographics?
An infographic is a visual representation of a topic that contains images, and data visualizations like pie charts and bar graphs. Infographics are frequently included on a single page or incorporated inside a more extensive page of text. As a consequence, they are excellent for slides, posters, and handouts.
Infographics have a distinct function in providing highly specialized information to a broad audience. To do this, they must simplify and delete technical details while maintaining the veracity and meaning of the original text. This suggests that audiences that would face challenges with the original subject can grasp and apply what they’ve learned practically.
Tips on choosing an infographic
- Choose the suitable visual style for your infographic: data may be presented in a variety of formats, so make sure you select the most relevant one for your data; pie charts, bar charts, maps, timelines, and so on.
- Consider your target audience: Determine what learning your audience needs, how advanced their understanding of the given topics is, and what visualizations will attract them.
- Headline: One of the things that a reader will notice before reading the details of your infographic is the headline. It must pique their interest.
If you need more information on how to choose the right infographic for your research, check out the article “The Easiest Way To Build Infographics” for additional details.
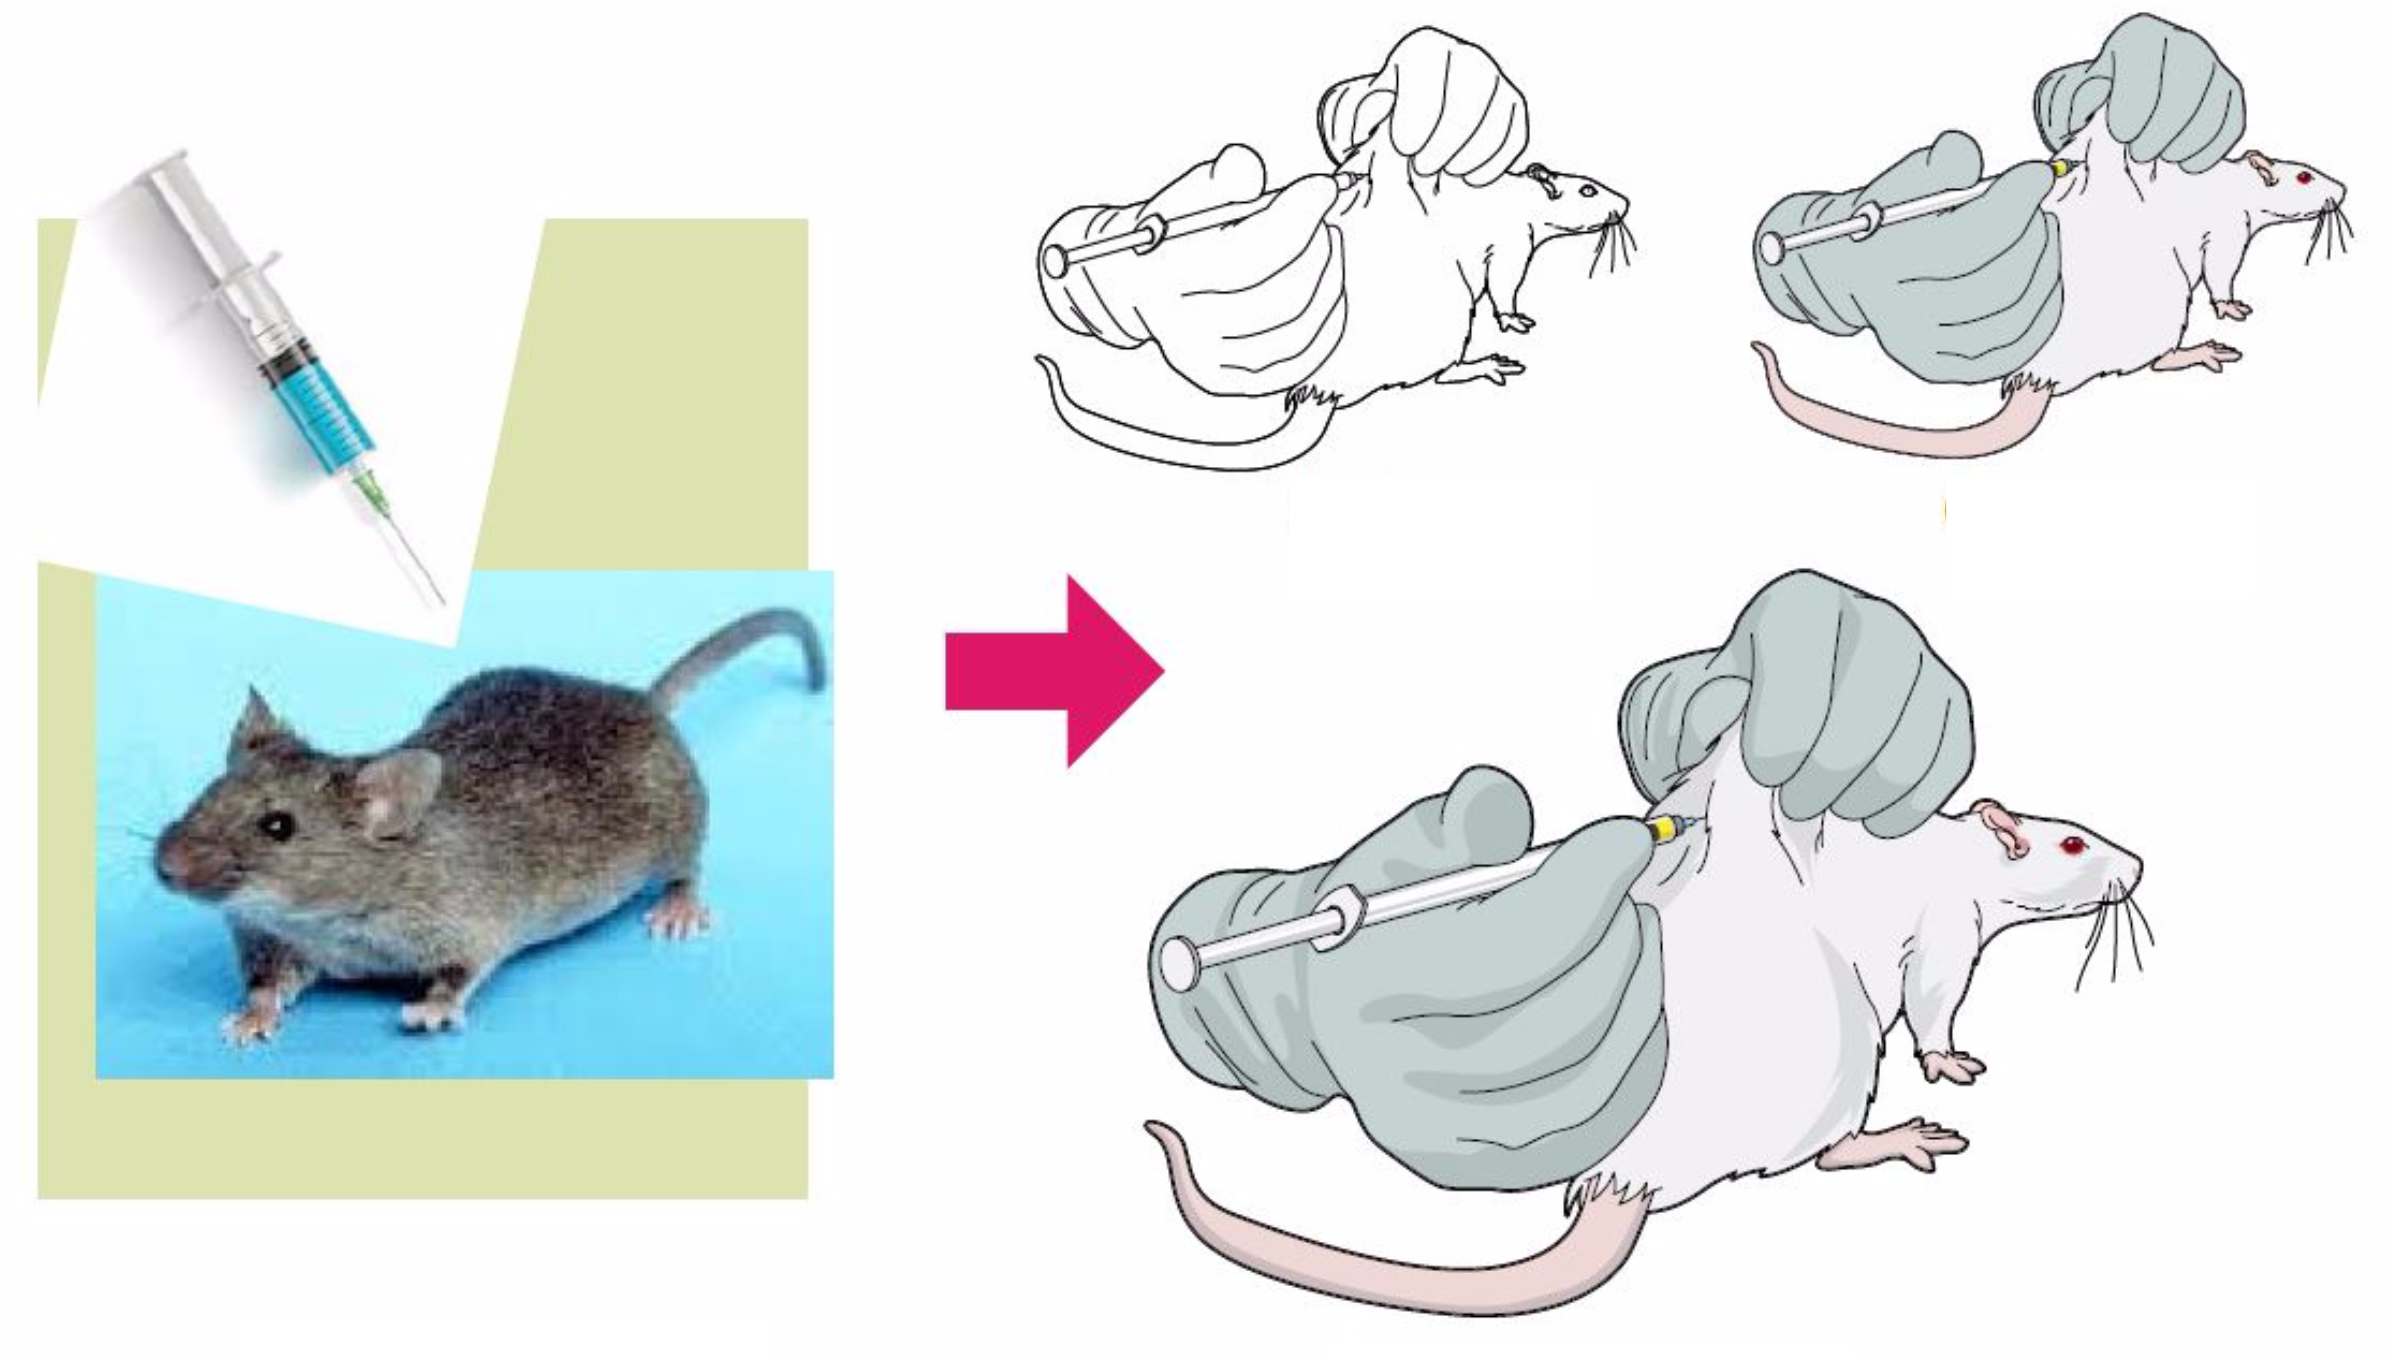
What’s the difference between graphical abstract and an infographic?
To summarize, the differences between them are minor, yet they exist. Infographics are graphical representations of information, and visual abstracts are a subtype of infographics that are employed to summarize the conclusion of an article.
The main difference is that the graphical abstract frequently consist of little or no text at all. As a result, it tends to better express the research’s overall findings or key findings. And the infographics, on the other hand, will display more text, maybe providing a stronger storytelling structure for a summary.
Where to find a free infographic maker and scientific illustrations?
Now that you understand the significance of using infographics in your research, Mind The Graph aims to make your life simpler by offering an easy-to-use tool with a huge number of templates that you can use according to the subject of your research. You may select the template that best meets your needs and alter all of the things inside it. You may modify the text, font, colors, icons, and everything else!

Subscribe to our newsletter
Exclusive high quality content about effective visual
communication in science.