Quite often scientists and researchers need a little hand to make graphical abstracts. Some of them look for design professionals, others – the most self sufficient ones – find Mind the Graph.
However, it seems like not everybody understands how Mind the Graph works.
Thus, we decided to explain in 3 steps how you can get your graphical abstracts done using our services!
STEP 1. Simplify your research
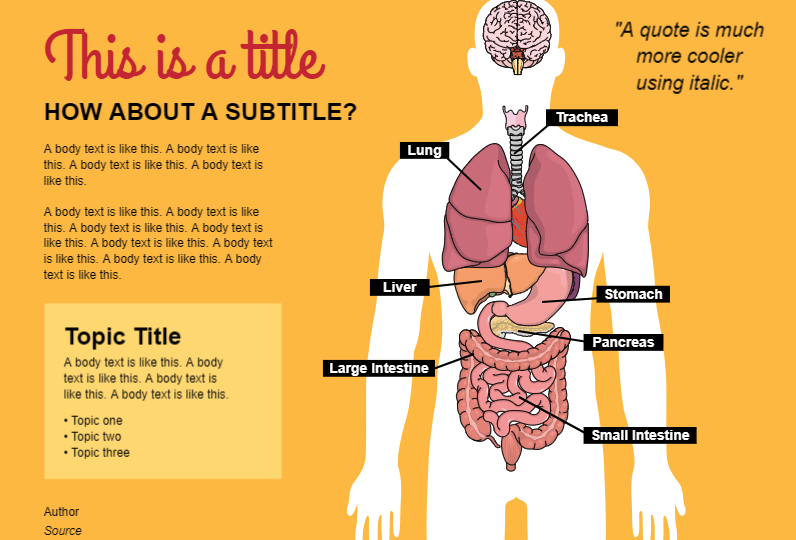
You need to make a written abstract of your research in order to publish, right? In the same line of thinking, try to transform the words in that abstract into images. Graphical abstracts are nothing else but a visual way to explain your research.
If you don’t feel very confident about it or just don’t know where to start, here are a couple of posts that will help you:
- Make your visual abstracts to Annals of Surgery!
- Graphical abstract: The extra mile
- How to make a good infographic?
STEP 2. Subscribe to Mind the Graph
You can give it a try and use our Free version just so you understand how the platform works. However, cool stuff such as making a full presentation and requesting new illustrations are only for subscribers.
Some people think that apart from paying the subscription, they also need to pay an extra amount for requesting new illustrations.
NO! YOU DON’T NEED TO PAY MORE. All subscribers can request any and as many new illustrations they want for as long as their subscription lasts.
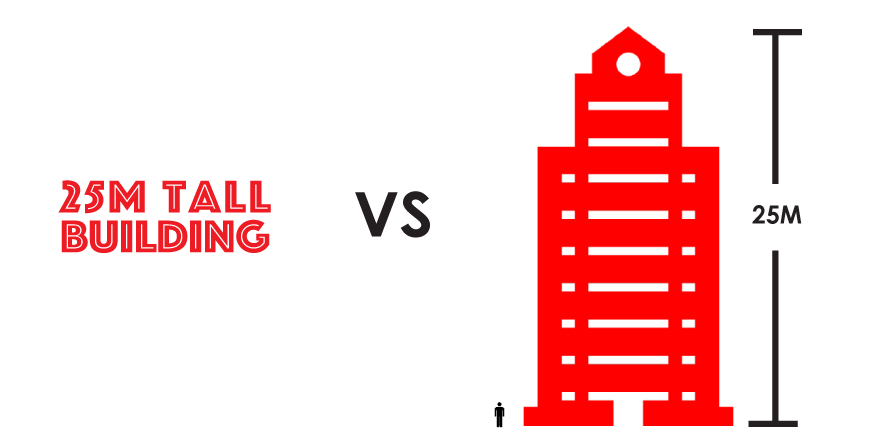
Would you like to take a look at some of the requests we receive from our users?
STEP 3. Make your graphical abstracts!
Once you figured out the information flow your graphical abstracts will have and found your way around Mind the Graph platform, you are ready!
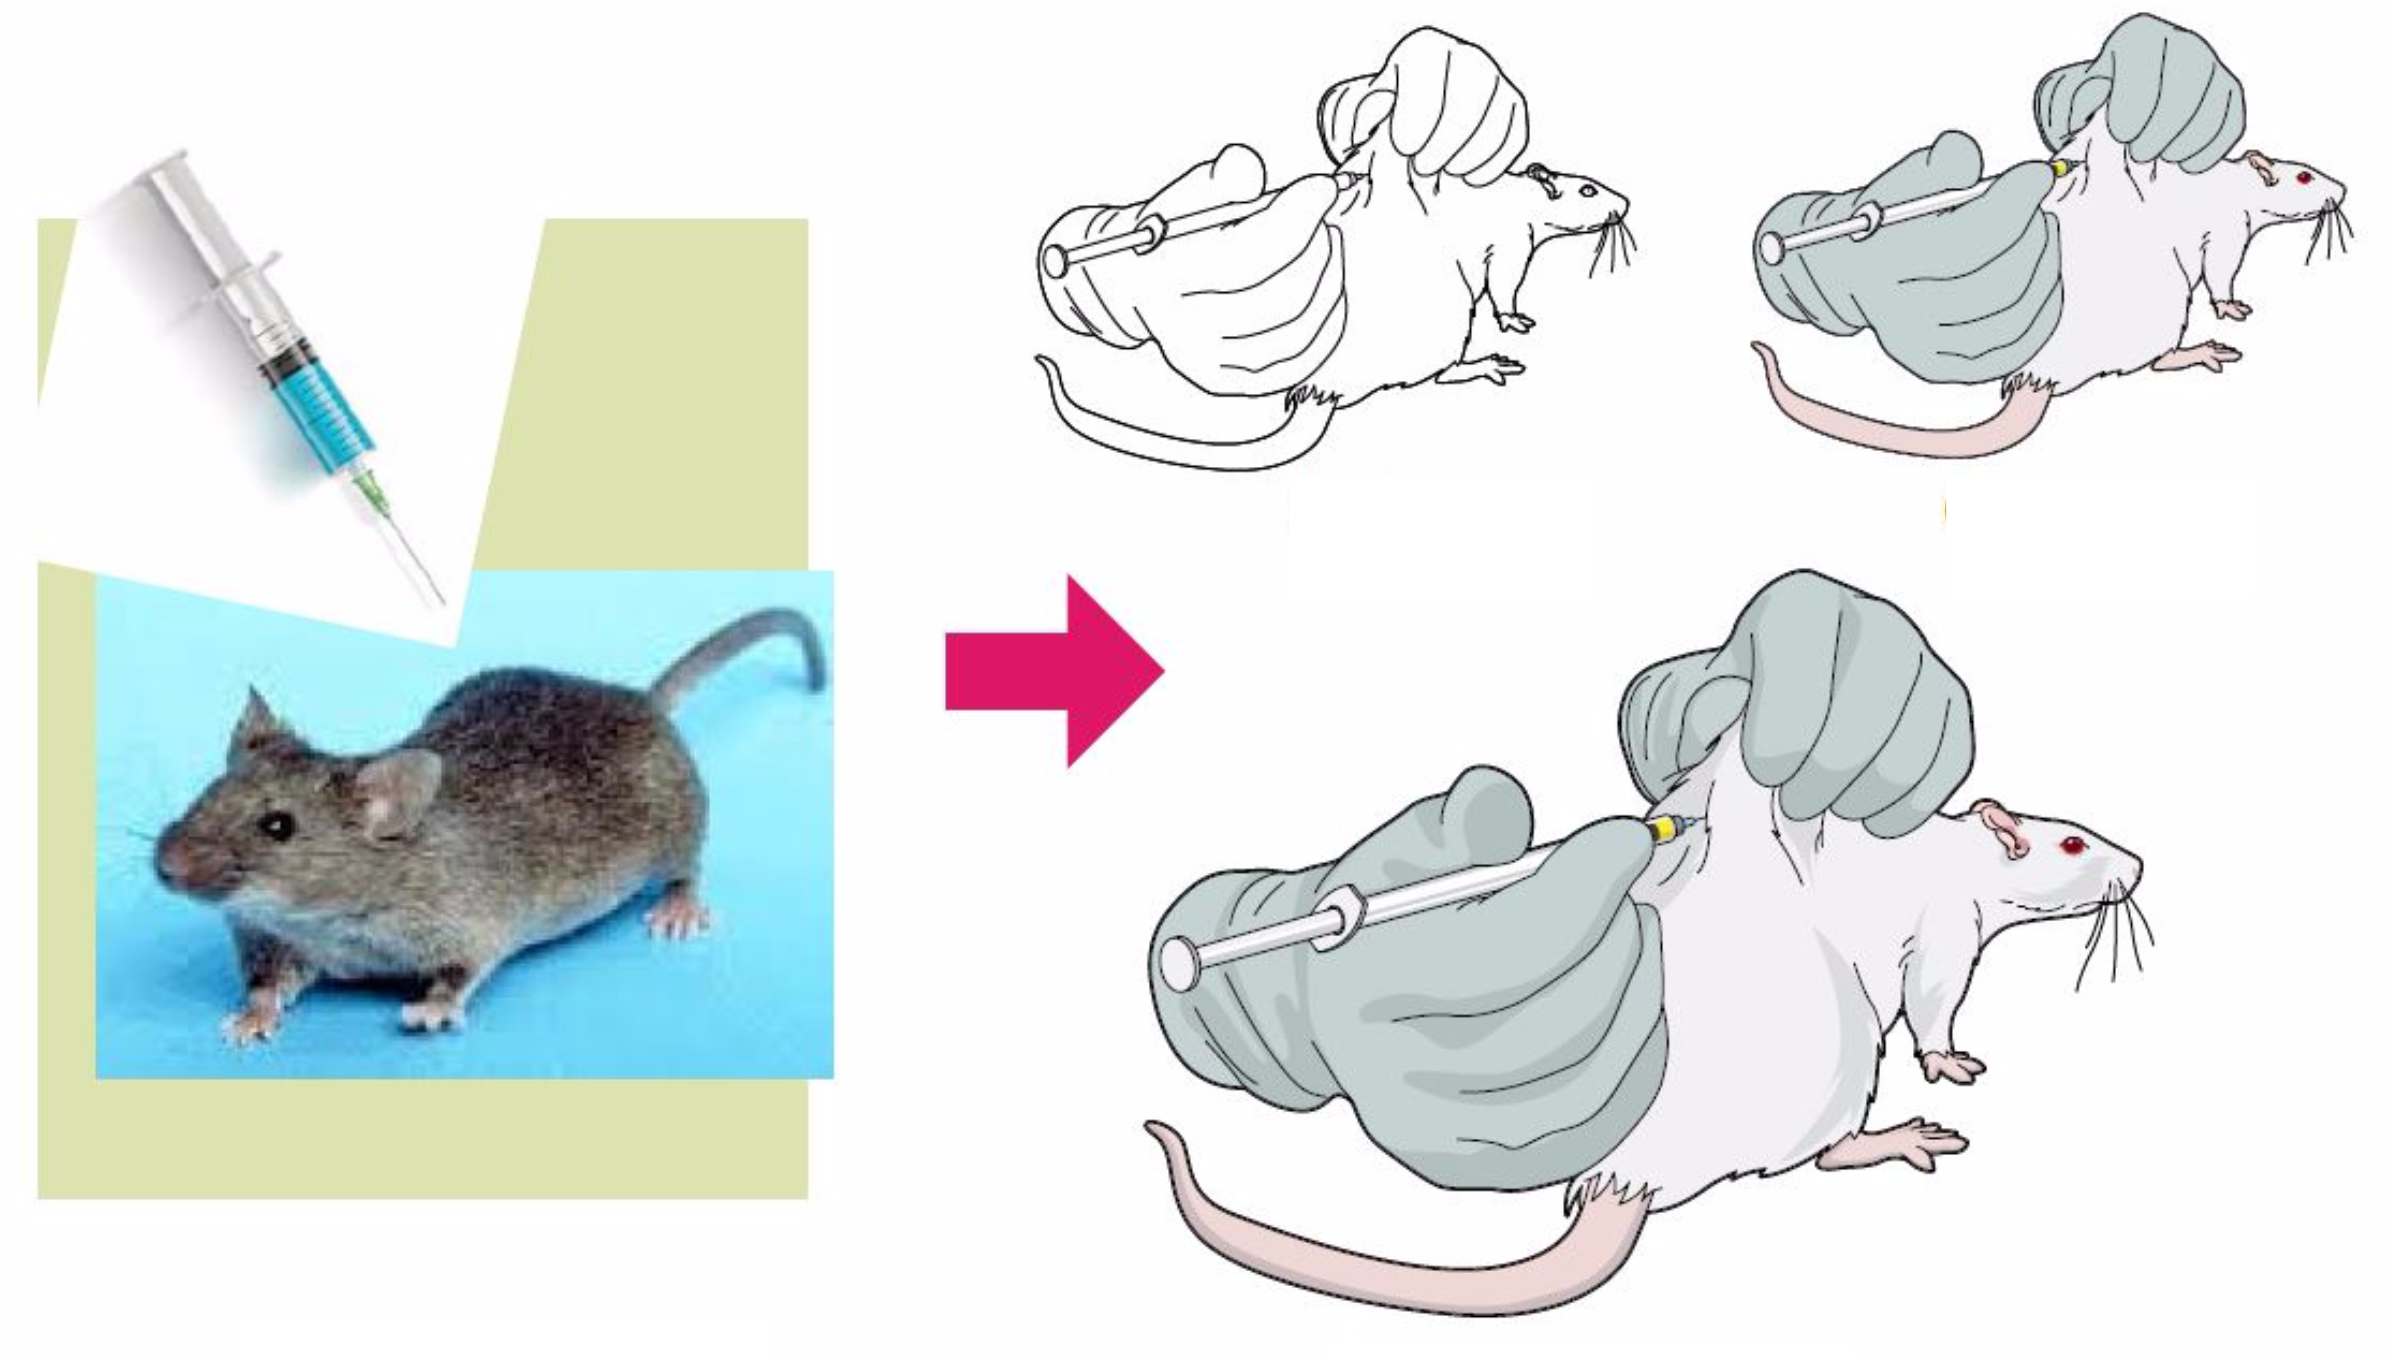
You can start simple and add new elements as you feel more comfortable. Here is an amazing example of a creation made by one of our users after he requested new illustrations:
Ready to give it a try? Follow these three steps and see the result. If you need any help, just contact us and we will work on it!

Subscribe to our newsletter
Exclusive high quality content about effective visual
communication in science.

