4 min læsning
02/08/2021
Mind The Graph Scientific Blog er beregnet til at hjælpe forskere med at lære, hvordan man kommunikerer videnskab på en ukompliceret måde.
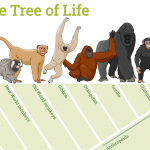
At dinosaurerne uddøde for omkring 65,5 millioner år siden, er ikke nogen nyhed for nogen. Dinosaurerne herskede over jordens overflade og himmel i 140 millioner år, mens vi - mennesker - kun har været her i 200.000 år. Den mest accepterede teori om masseudryddelsen er, at en asteroide fremprovokerede døden [...].
Ja, desværre er dit kæledyr også i fare for at få COVID-19. Ligesom vi er [...]
Monokultur har været den vigtigste form, som landmænd og landbrugere har brugt til at producere fødevarer i [...]

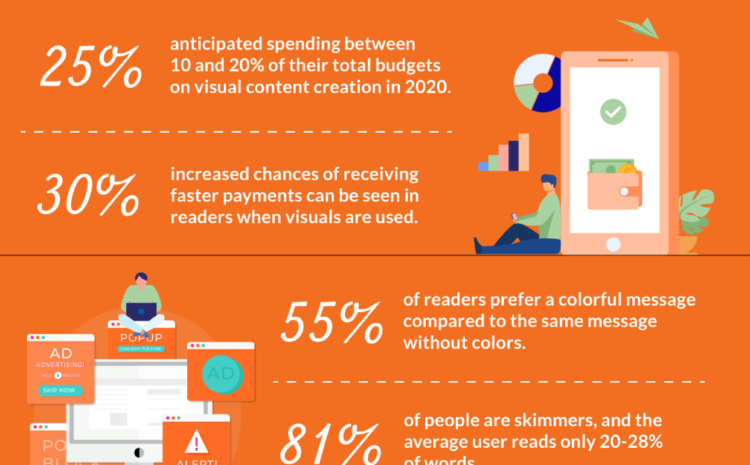
Online markedsføring er i konstant udvikling. De strategier, der er relevante i dag, er måske ikke relevante [...].
Alzheimers sygdom (AD) er en neurodegenerativ sygdom, der er ansvarlig for mere end 50% af alle tilfælde af demens [...].
Hver maskine har et kontrolpanel til at styre forskellige funktioner, især tændingen og [...].
Det er ikke længere mærkeligt at høre folk sige, at de har en 5G-forbindelse [...].
Cannabisbehandlinger har fået stor opmærksomhed fra det videnskabelige og medicinske samfund hele [...].
PyScratch er en ny open source-software implementeret i Python til analyse af migrationsdata med [...].
Mere end halvdelen af alle tilfælde af demens klassificeres i dag som Alzheimers sygdom [...].
Neuroplasticitet er hjernens evne til at ændre sine forbindelser som reaktion på personlige [...]
Medmindre du lever i en boble, vil du vide, at visuel content marketing er [...].
Hele nervesystemet er baseret på aktionspotentialer og synapser til at transmittere information gennem [...].