4 min lesning
02/08/2021
Vitenskapsbloggen Mind The Graph er ment å hjelpe forskere med å lære å kommunisere vitenskap på en ukomplisert måte.
At dinosaurene døde ut - for rundt 65,5 millioner år siden - er ingen nyhet for noen. Dinosaurene hersket på jordens overflate og himmel i 140 millioner år, mens vi mennesker bare har vært her i 200 000 år. Den mest aksepterte teorien om masseutryddelsen er at en asteroide utløste døden [...].
Ja, dessverre er kjæledyret ditt også i faresonen for å bli smittet av covid-19. Akkurat som vi er [...]
Monokulturer har vært den vanligste formen for matproduksjon blant bønder og jordbrukere i [...].

Nettmarkedsføring er i stadig utvikling. De strategiene som er relevante i dag, er kanskje ikke relevante [...].
Alzheimers sykdom (AD) er en nevrodegenerativ sykdom som er ansvarlig for mer enn 50% av demenstilfellene [...].
Hver maskin har et kontrollpanel for å styre ulike funksjoner, spesielt på- og [...].
Det er ikke lenger rart å høre folk si at de har 5G-tilkobling [...].
Cannabisbehandlinger har fått stor oppmerksomhet fra det vitenskapelige og medisinske miljøet i hele [...].
PyScratch er en ny programvare med åpen kildekode implementert i Python for analyse av migrasjonsdata, med [...].
Mer enn halvparten av demenstilfellene klassifiseres i dag som Alzheimers sykdom [...].
Nevroplastisitet er hjernens evne til å endre sine forbindelser som respons på personlige [...].
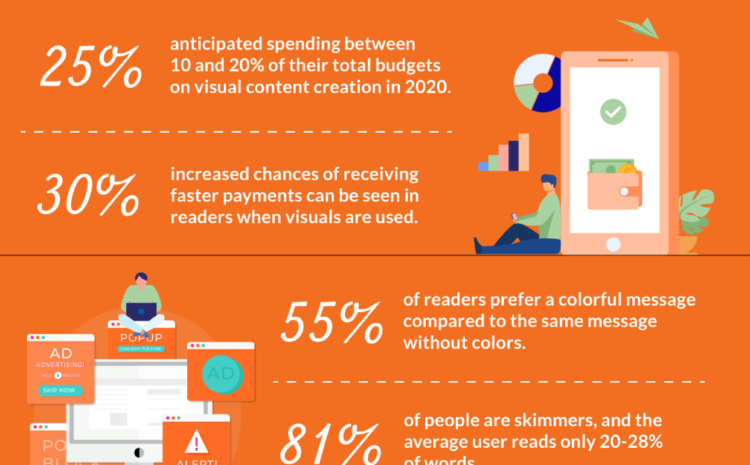
Med mindre du lever i en boble, vet du at visuell innholdsmarkedsføring er [...].
Hele nervesystemet er basert på aksjonspotensialer og synapser for å overføre informasjon gjennom [...].