2 min læsning
08/19/2018
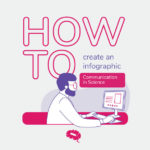
Mind The Graph Scientific Blog er beregnet til at hjælpe forskere med at lære, hvordan man kommunikerer videnskab på en ukompliceret måde.
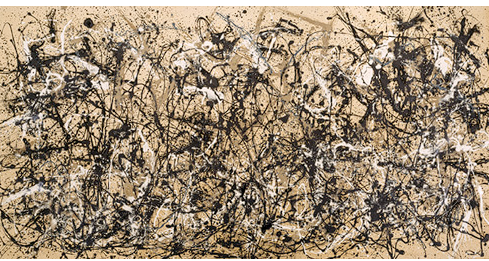
Når det handler om videnskabskunst, tænker de fleste af os straks på superrealistiske og komplekse illustrationer. Men hvad nu, hvis det ikke behøver at være sådan? Det var, hvad Charley Harper tænkte. På et tidspunkt, hvor videnskabskunst handlede om illustrationer, der trofast repræsenterede den virkelige verdens mindste detaljer, gav Charley os en ny [...]
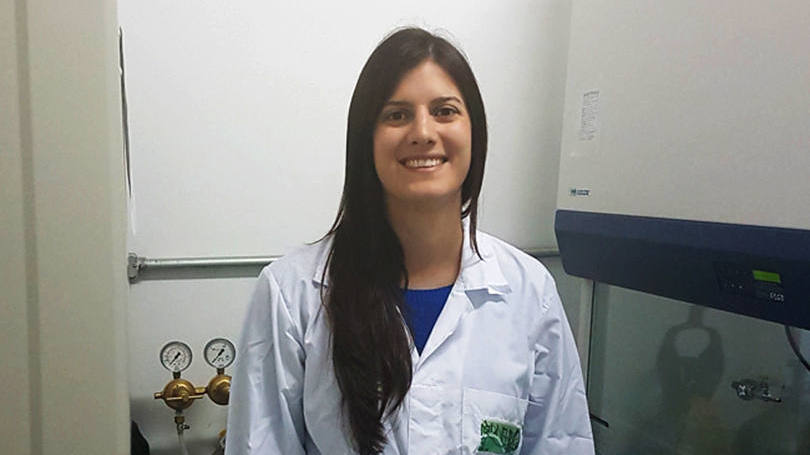
Gabriela Trevisan er postdoc i biologiske videnskaber og har specialiseret sig i smerte og inflammatoriske processer. Hendes [...]
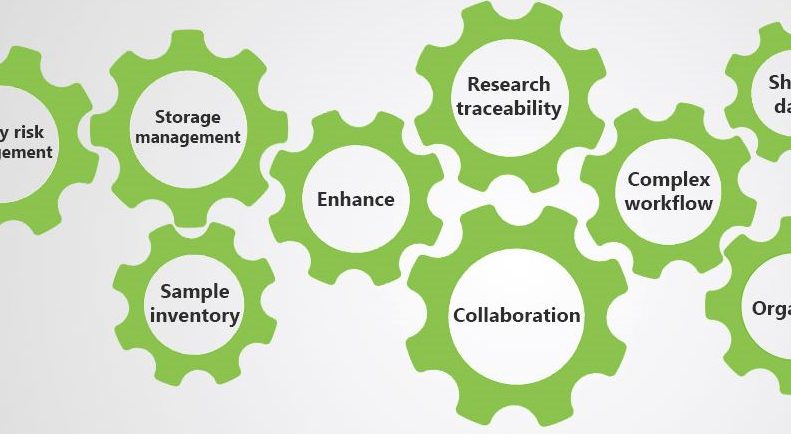
Hvad hvis jeg fortæller dig, at der findes et værktøj kaldet LabCollector, der kan gøre din [...].
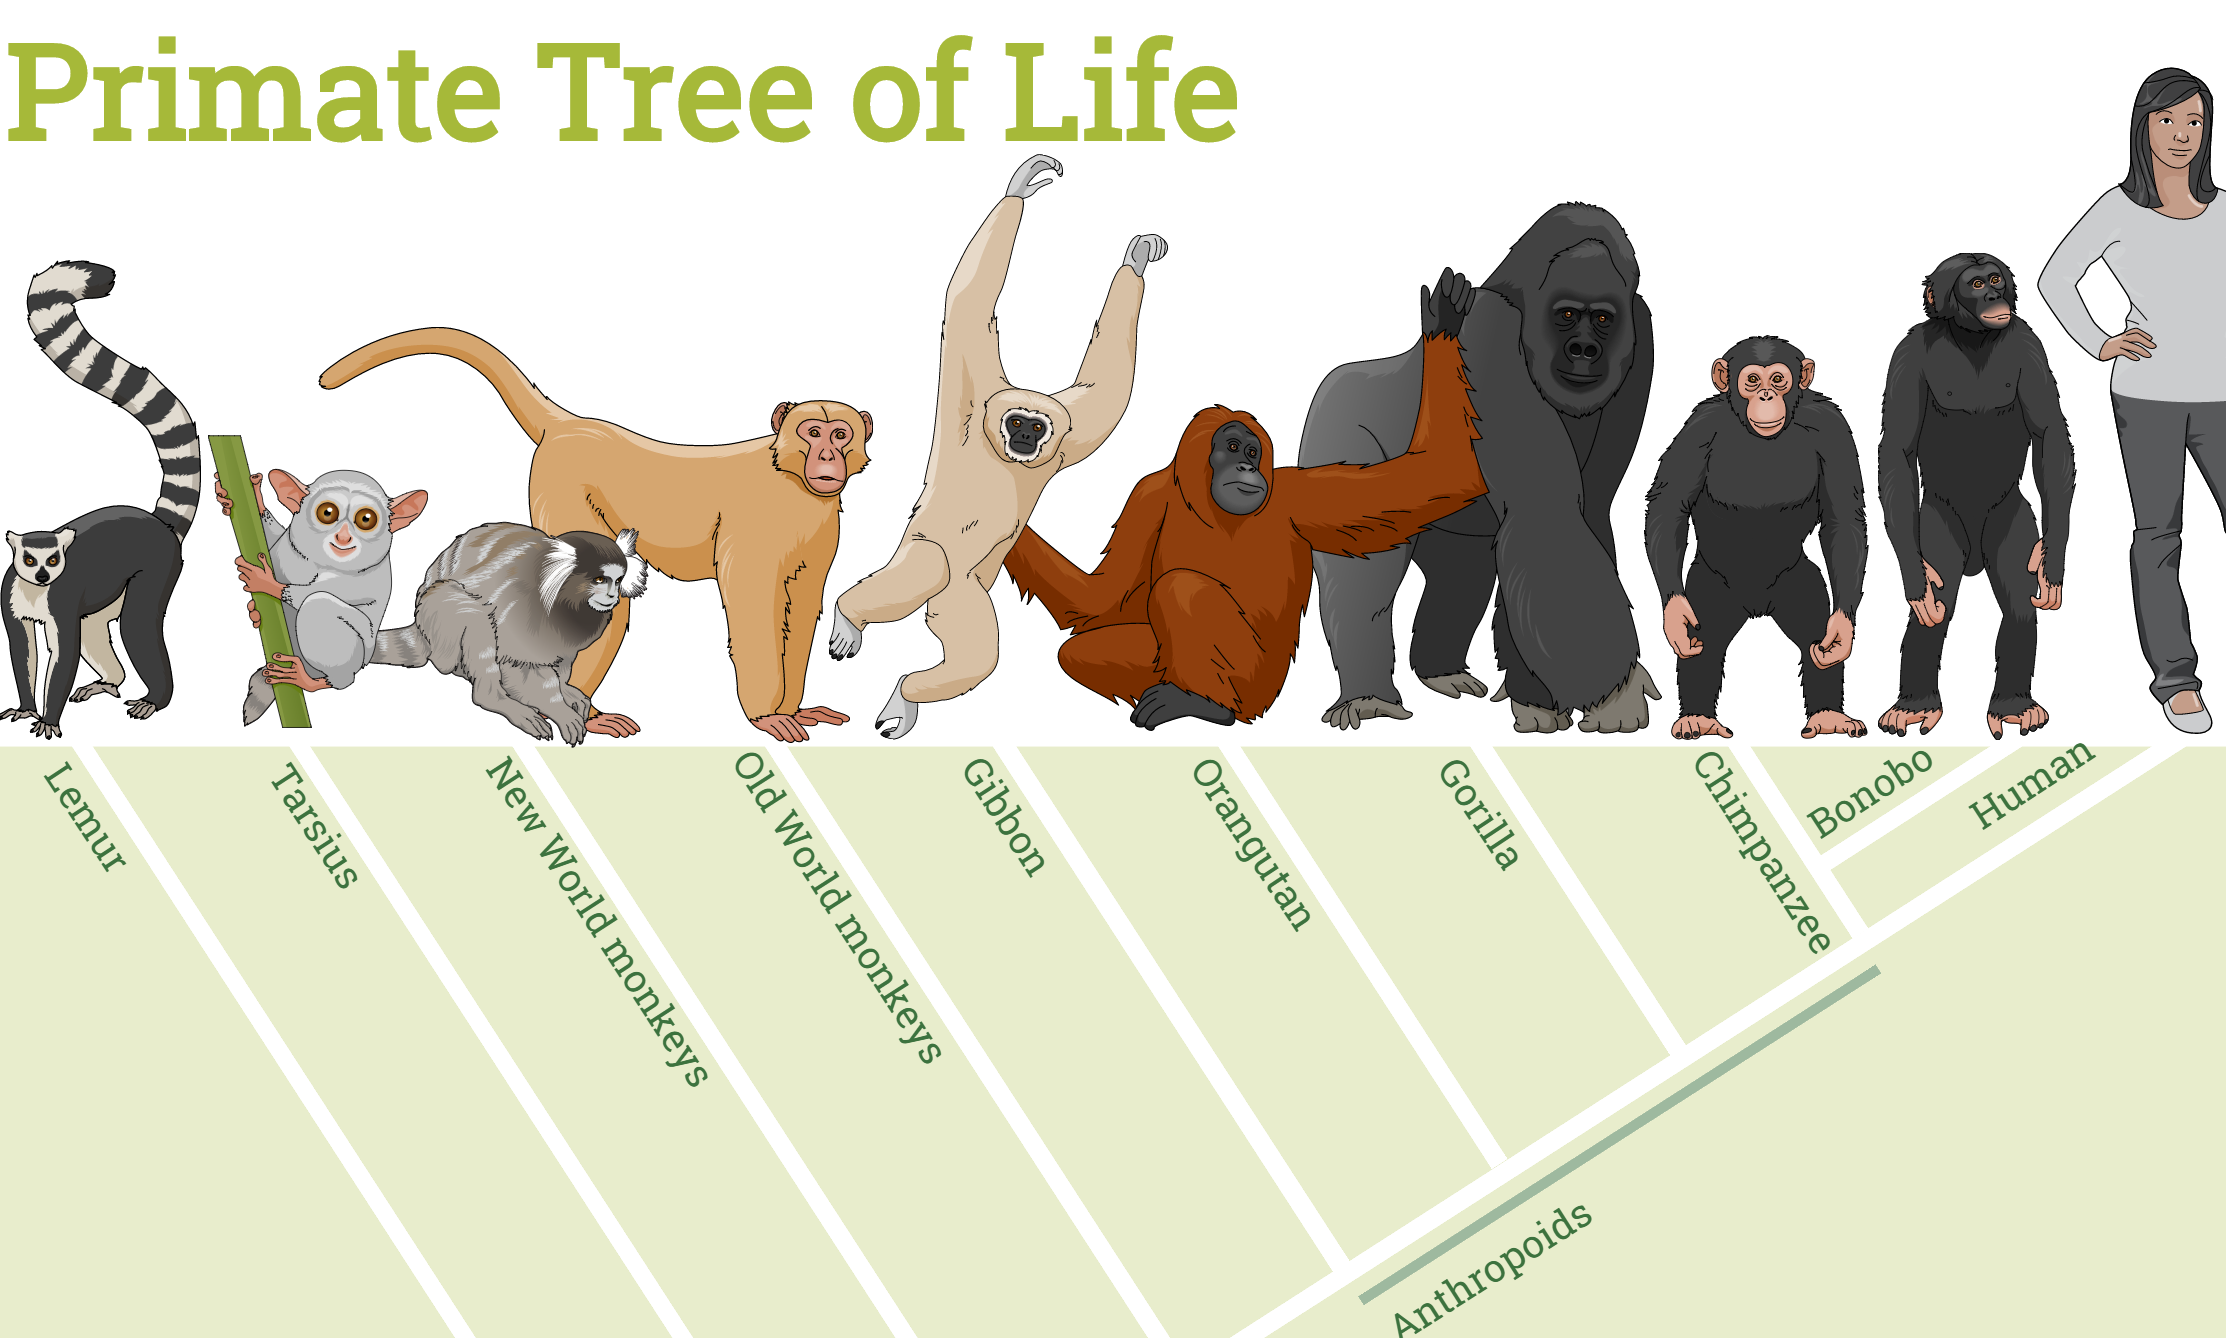
Har du brug for at lave et stamtræ over primater? Eller noget andet relateret til primater? [...]
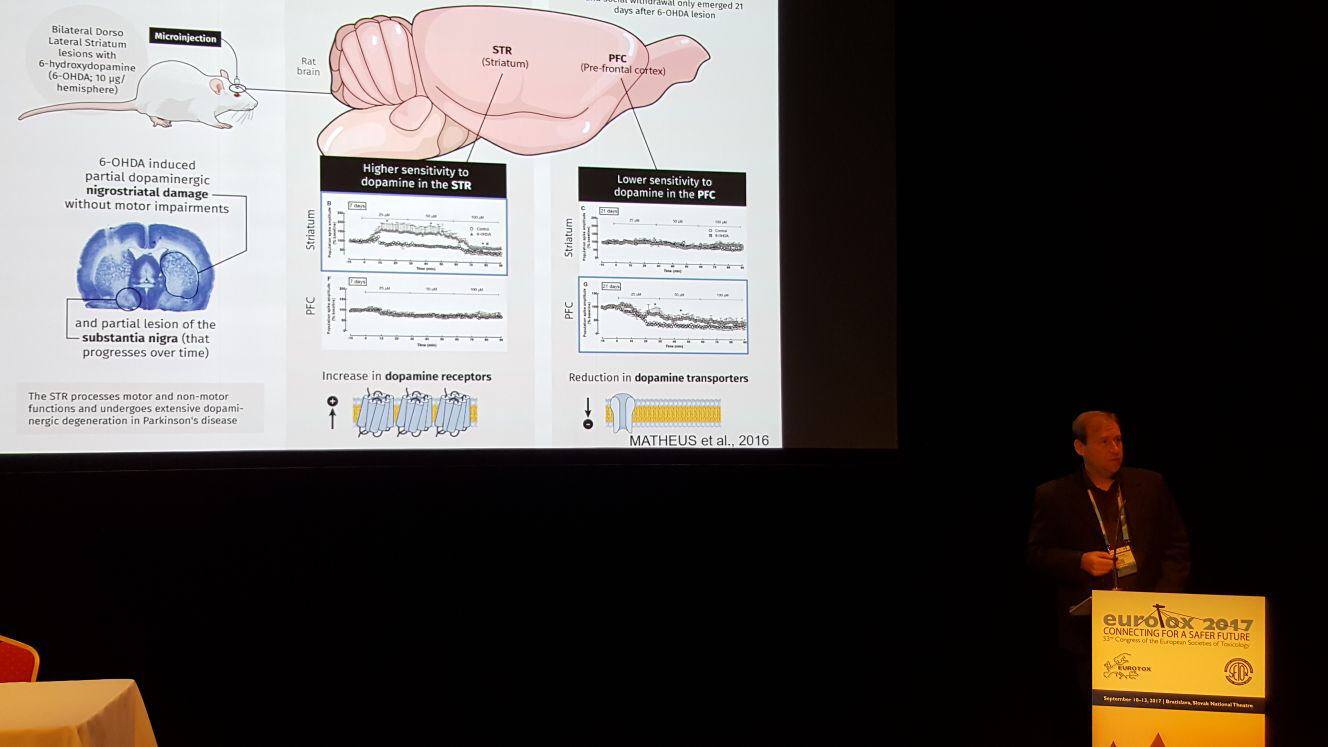
Du arbejder i årevis med at bruge penge, præsentere dine resultater på konferencer, stå over for de daglige udfordringer [...].
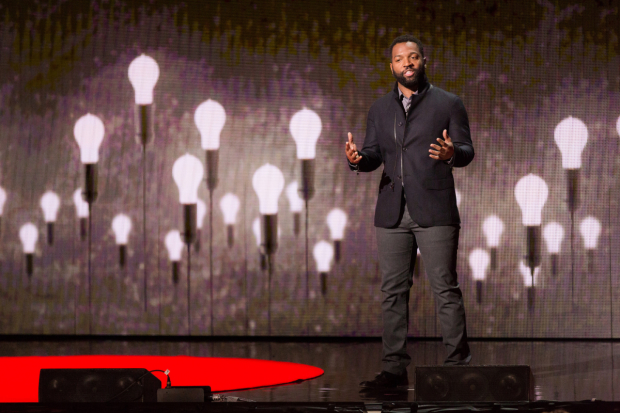
Alle kender TED Talks. De er informative, innovative og trendy. TED dukkede første gang op i 1984 [...]
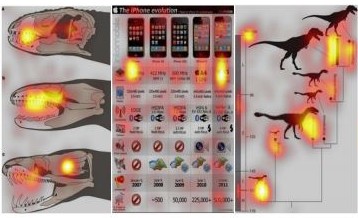
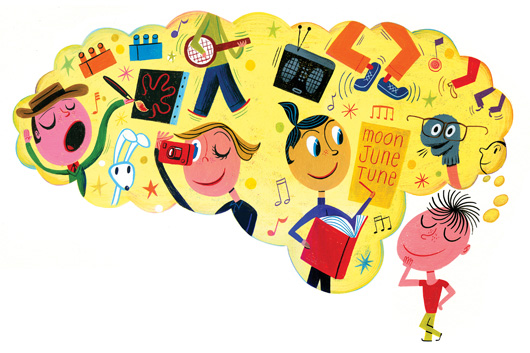
Et billede siger mere end tusind ord. Tak din visuelle kognition for det! Vi tænker ofte [...]
Har du bemærket, hvad der sker inden for videnskabskommunikation? Hver dag kommer der en bølge af nye data [...]
En forskers arbejdsliv er ikke bare "at have en laboratoriekittel på og forske". Vi har også [...]
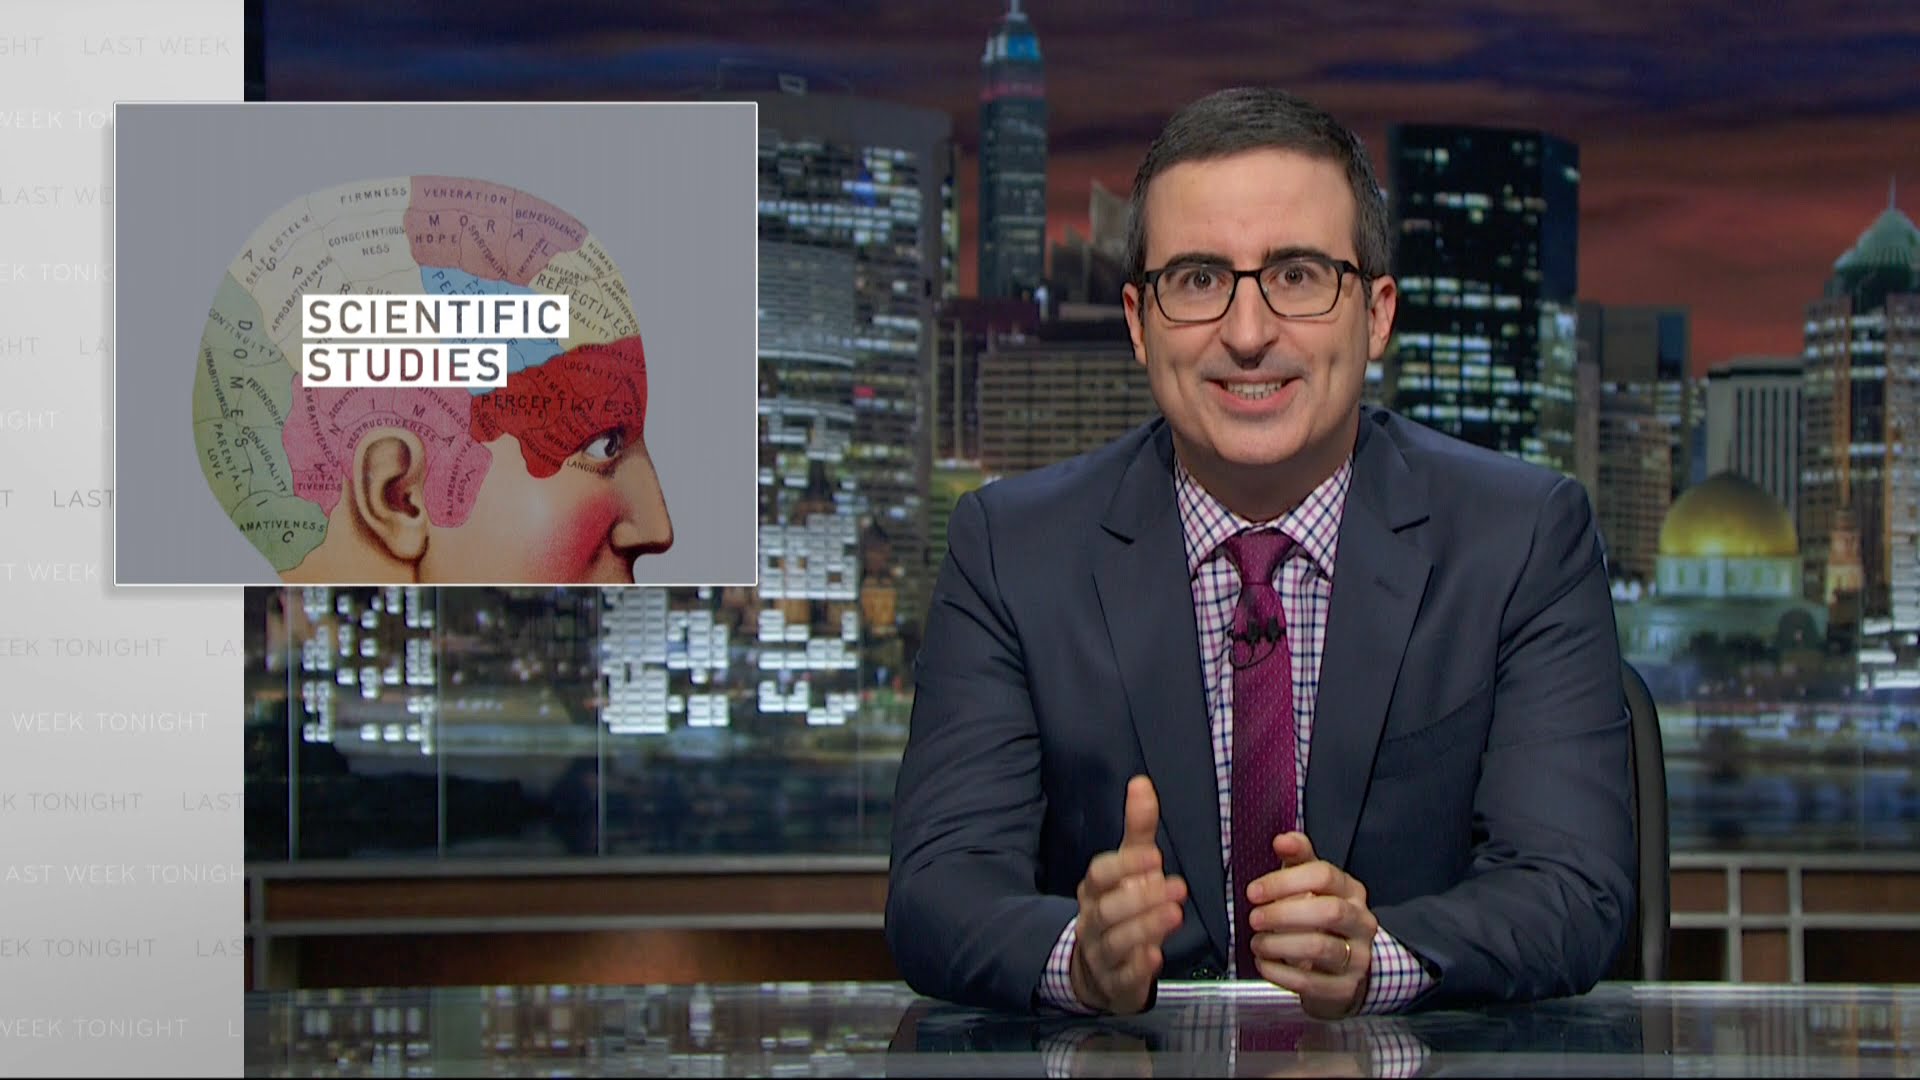
Hvor ofte hører man i nyhederne, at et nyt fund er baseret på [...].
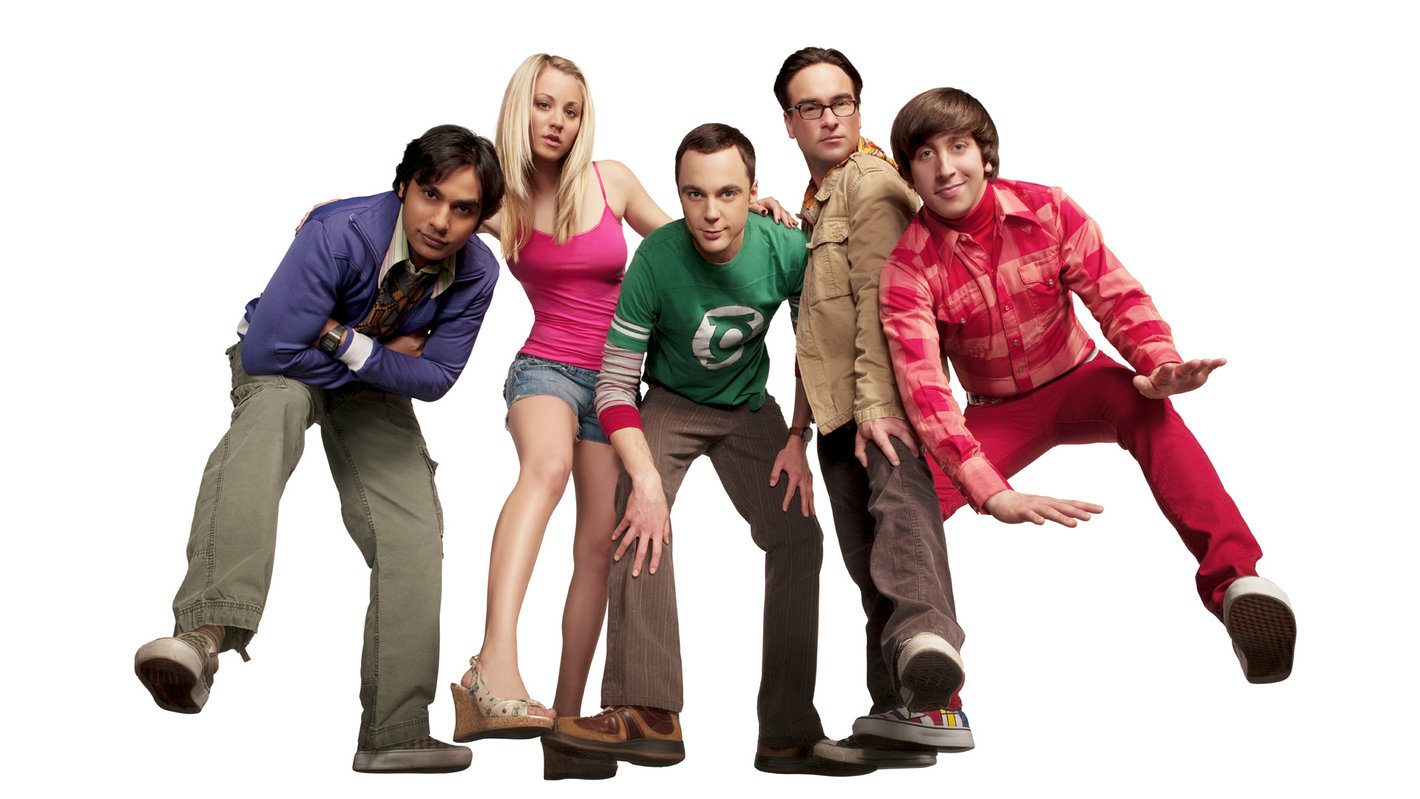
Verden er drevet af stereotyper. Derfor er det ingen overraskelse, at der i videnskaben [...]
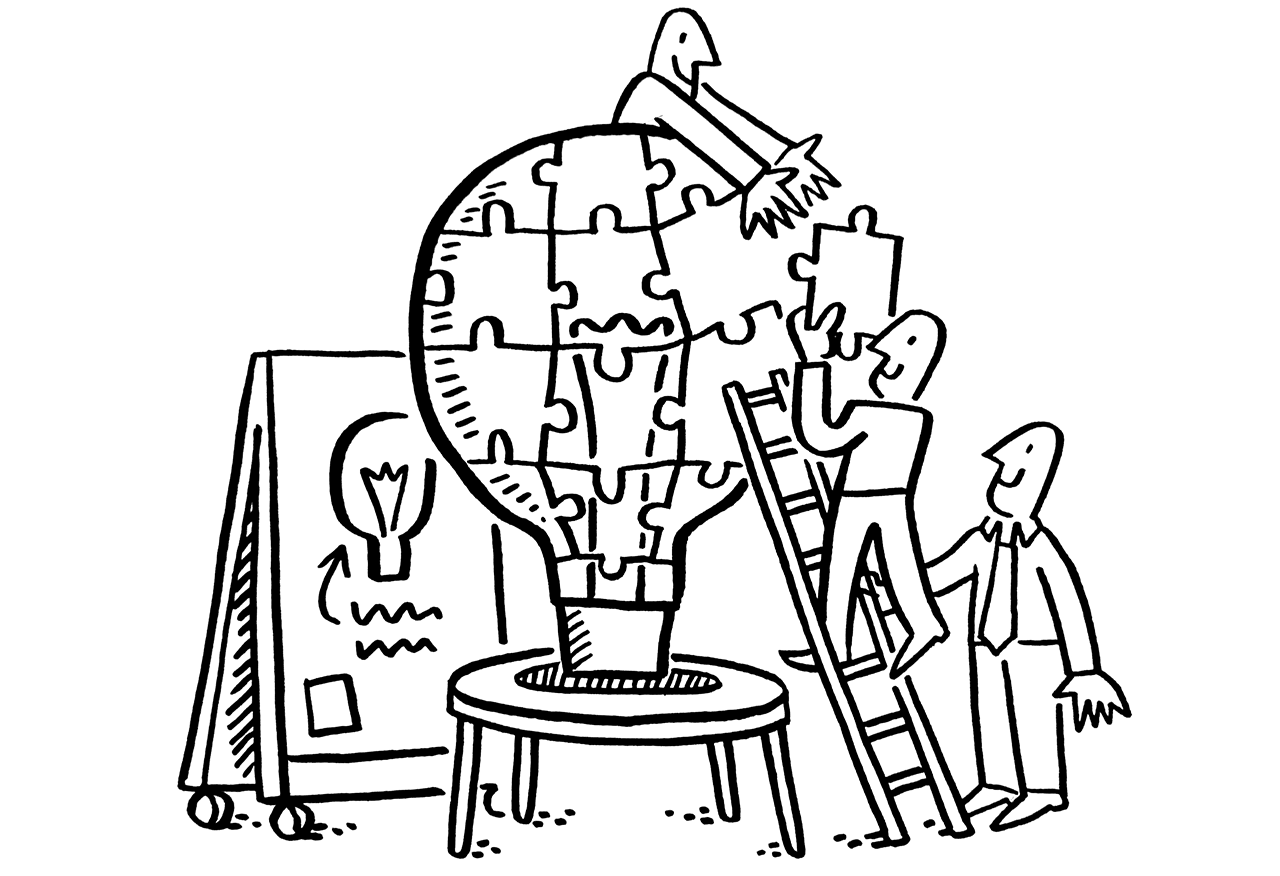
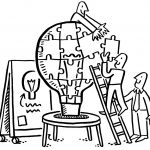
Mennesket har gjort opdagelser i århundreder. Hjulet, nye kontinenter, penicillin og meget mere. [...]
Hvad er de vigtigste færdigheder for en videnskabsmand? At være kreativ, nysgerrig og åben er en [...].