4 min læsning
09/20/2019
Mind The Graph Scientific Blog er beregnet til at hjælpe forskere med at lære, hvordan man kommunikerer videnskab på en ukompliceret måde.
Ja, den globale opvarmning er reel. I hvert fald ifølge videnskaben. Det er det korte svar. Men det er normalt at være forvirret over navnet global opvarmning. Især når vinteren er på vej, man fryser og forventer sne i weekenden. Så lad os se på de nyeste videnskabelige data for at forstå. 01. Klima X Vejr Det [...]
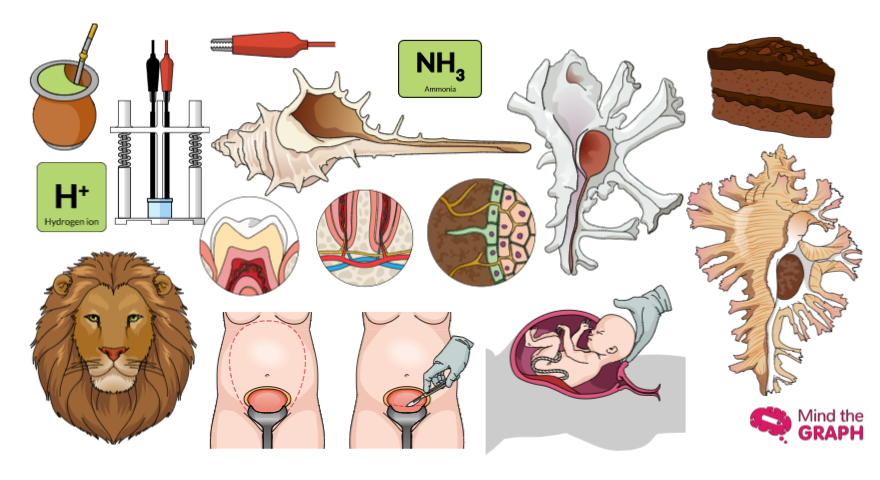
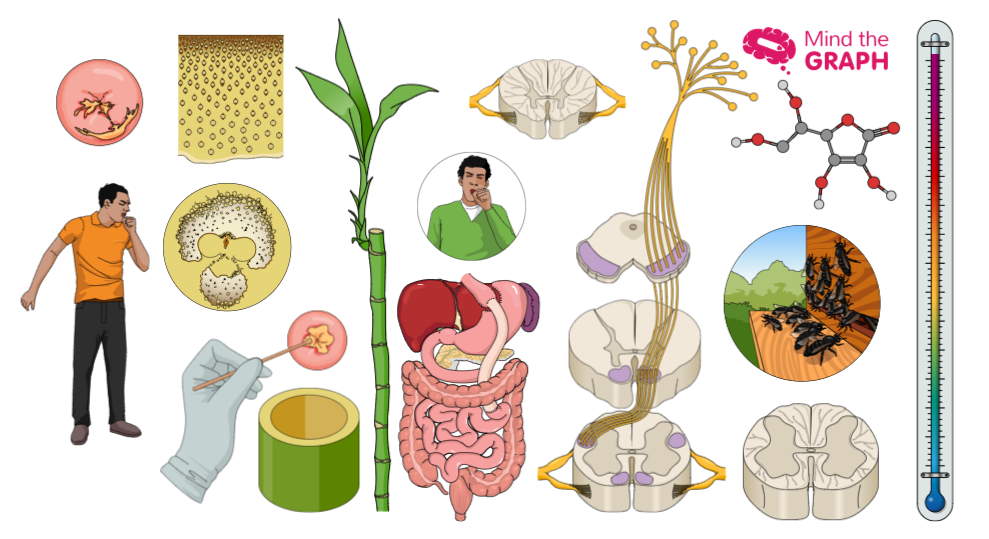
Hej med jer. Er du klar til at se ugens bedste videnskabelige illustrationer? Som [...]
Visuelle ressourcer er stærke til at kommunikere bedre inden for videnskab. Videnskabelige illustrationer er et godt eksempel [...]
Som du sikkert ved på nuværende tidspunkt, har vi det største bibliotek af præcise [...].
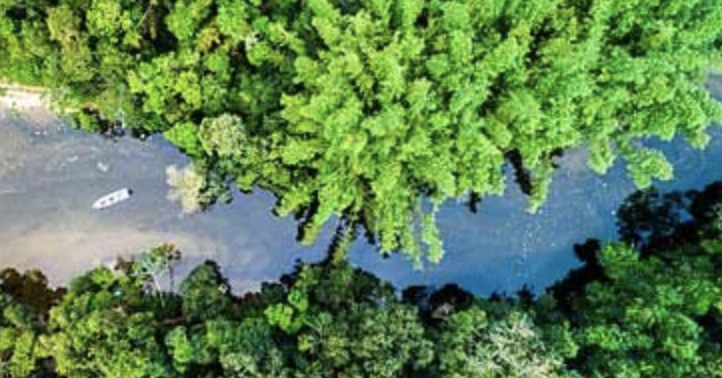
De sidste dage har været hårde, ikke? Skovbrandene i Amazonas regnskov bliver en trend [...]
Escrever um artigo científico é um passo muito importante da vida científica. I første omgang skal du [...]
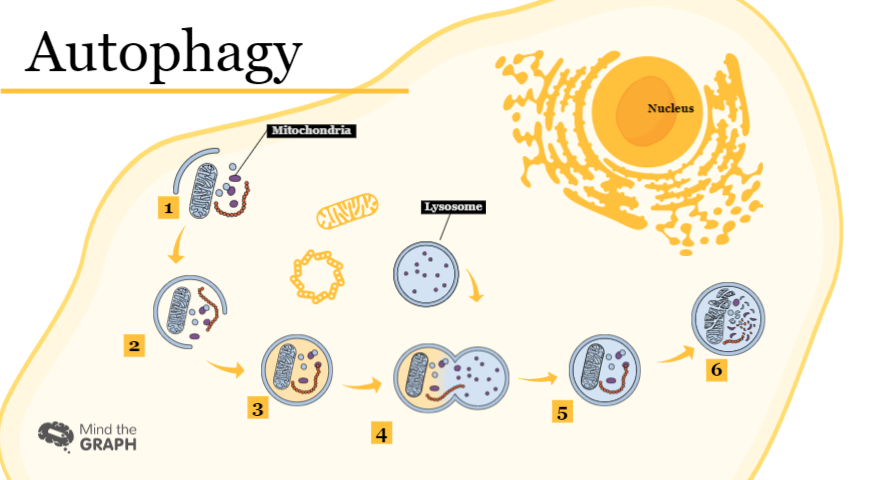
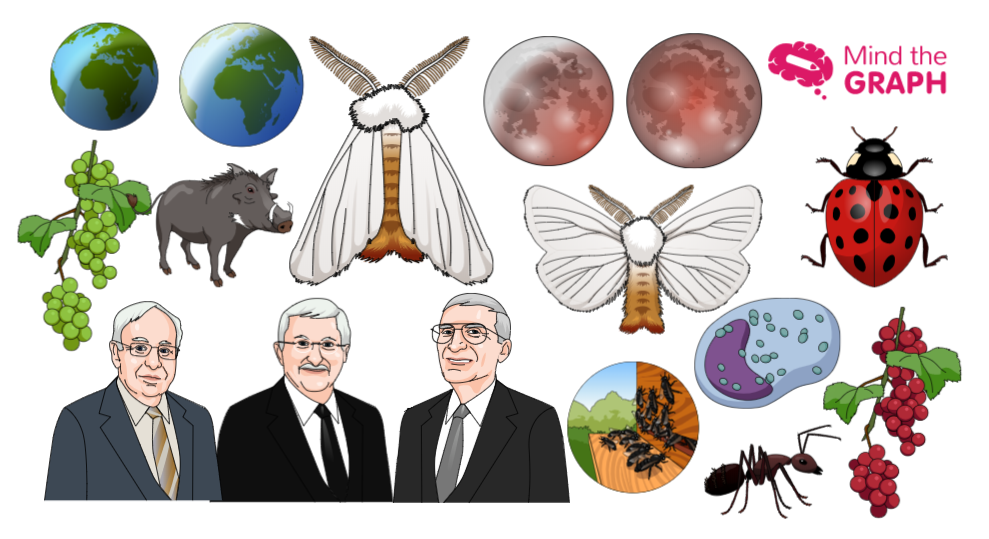
Hej med jer! Er du klar til at se de nye videnskabelige illustrationer? Vi har en masse [...]
Vi kan se regnskovenes enorme størrelse, når vi kigger på billeder af trætoppene [...].
Amazonas regnskov er det biologisk mest mangfoldige sted på jorden. Af alle de kendte [...]
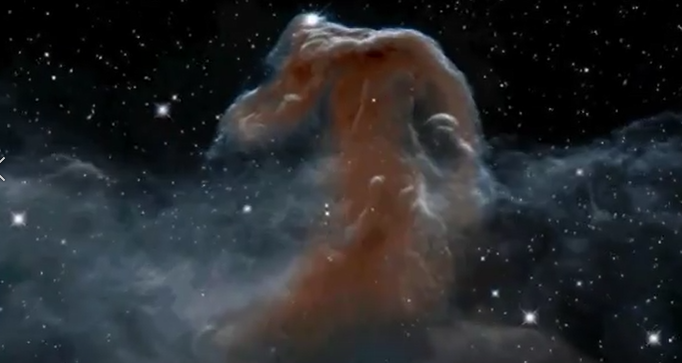
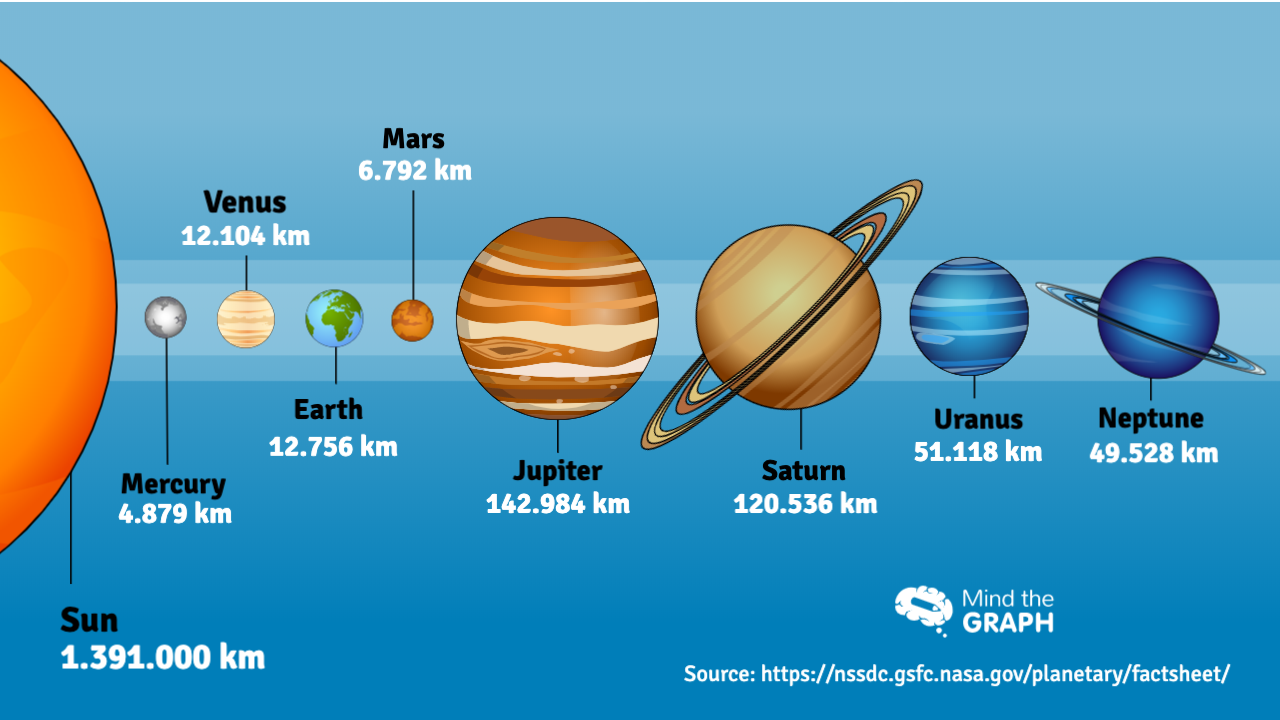
Hvor stort og mangfoldigt er universet? Det er et svært spørgsmål, selv for fysikerne. [...]
Omfavn dig selv, weekenden er på vej! Det er fredag igen, og vi venter på [...]
Hej, alle sammen! Vi har nye videnskabelige illustrationer til dig! Hver fredag viser vi, hvad der er [...]
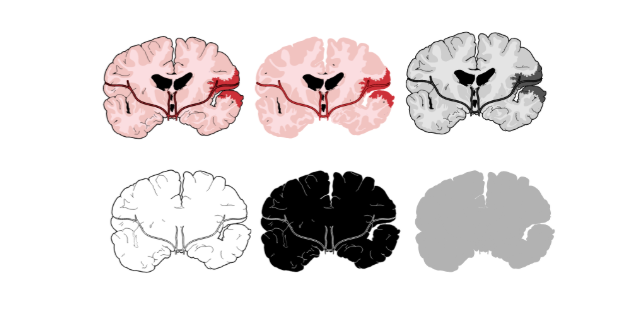
Dette indlæg handler om et meget alvorligt og vigtigt emne. Hvert år dør næsten 800.000 mennesker [...]