4 min läsning
07/30/2019
Den vetenskapliga bloggen Mind The Graph är tänkt att hjälpa forskare att lära sig hur man kommunicerar vetenskap på ett okomplicerat sätt.
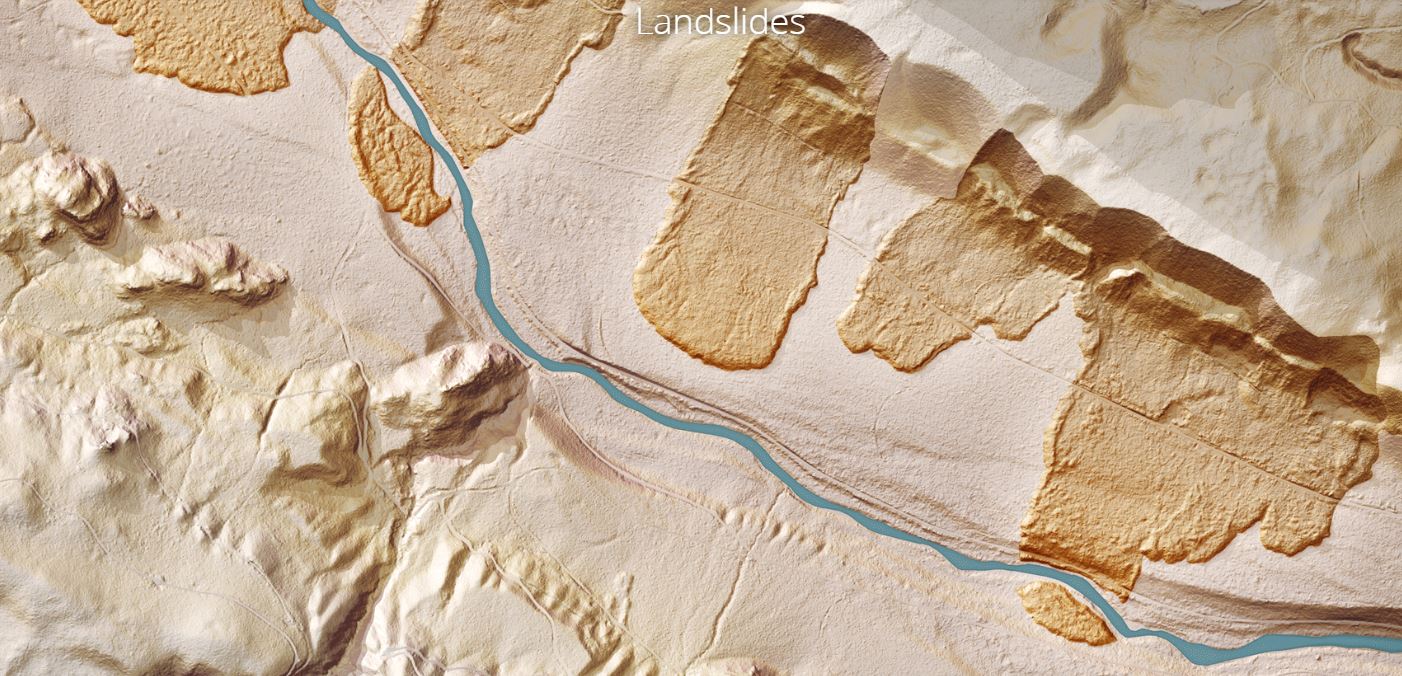
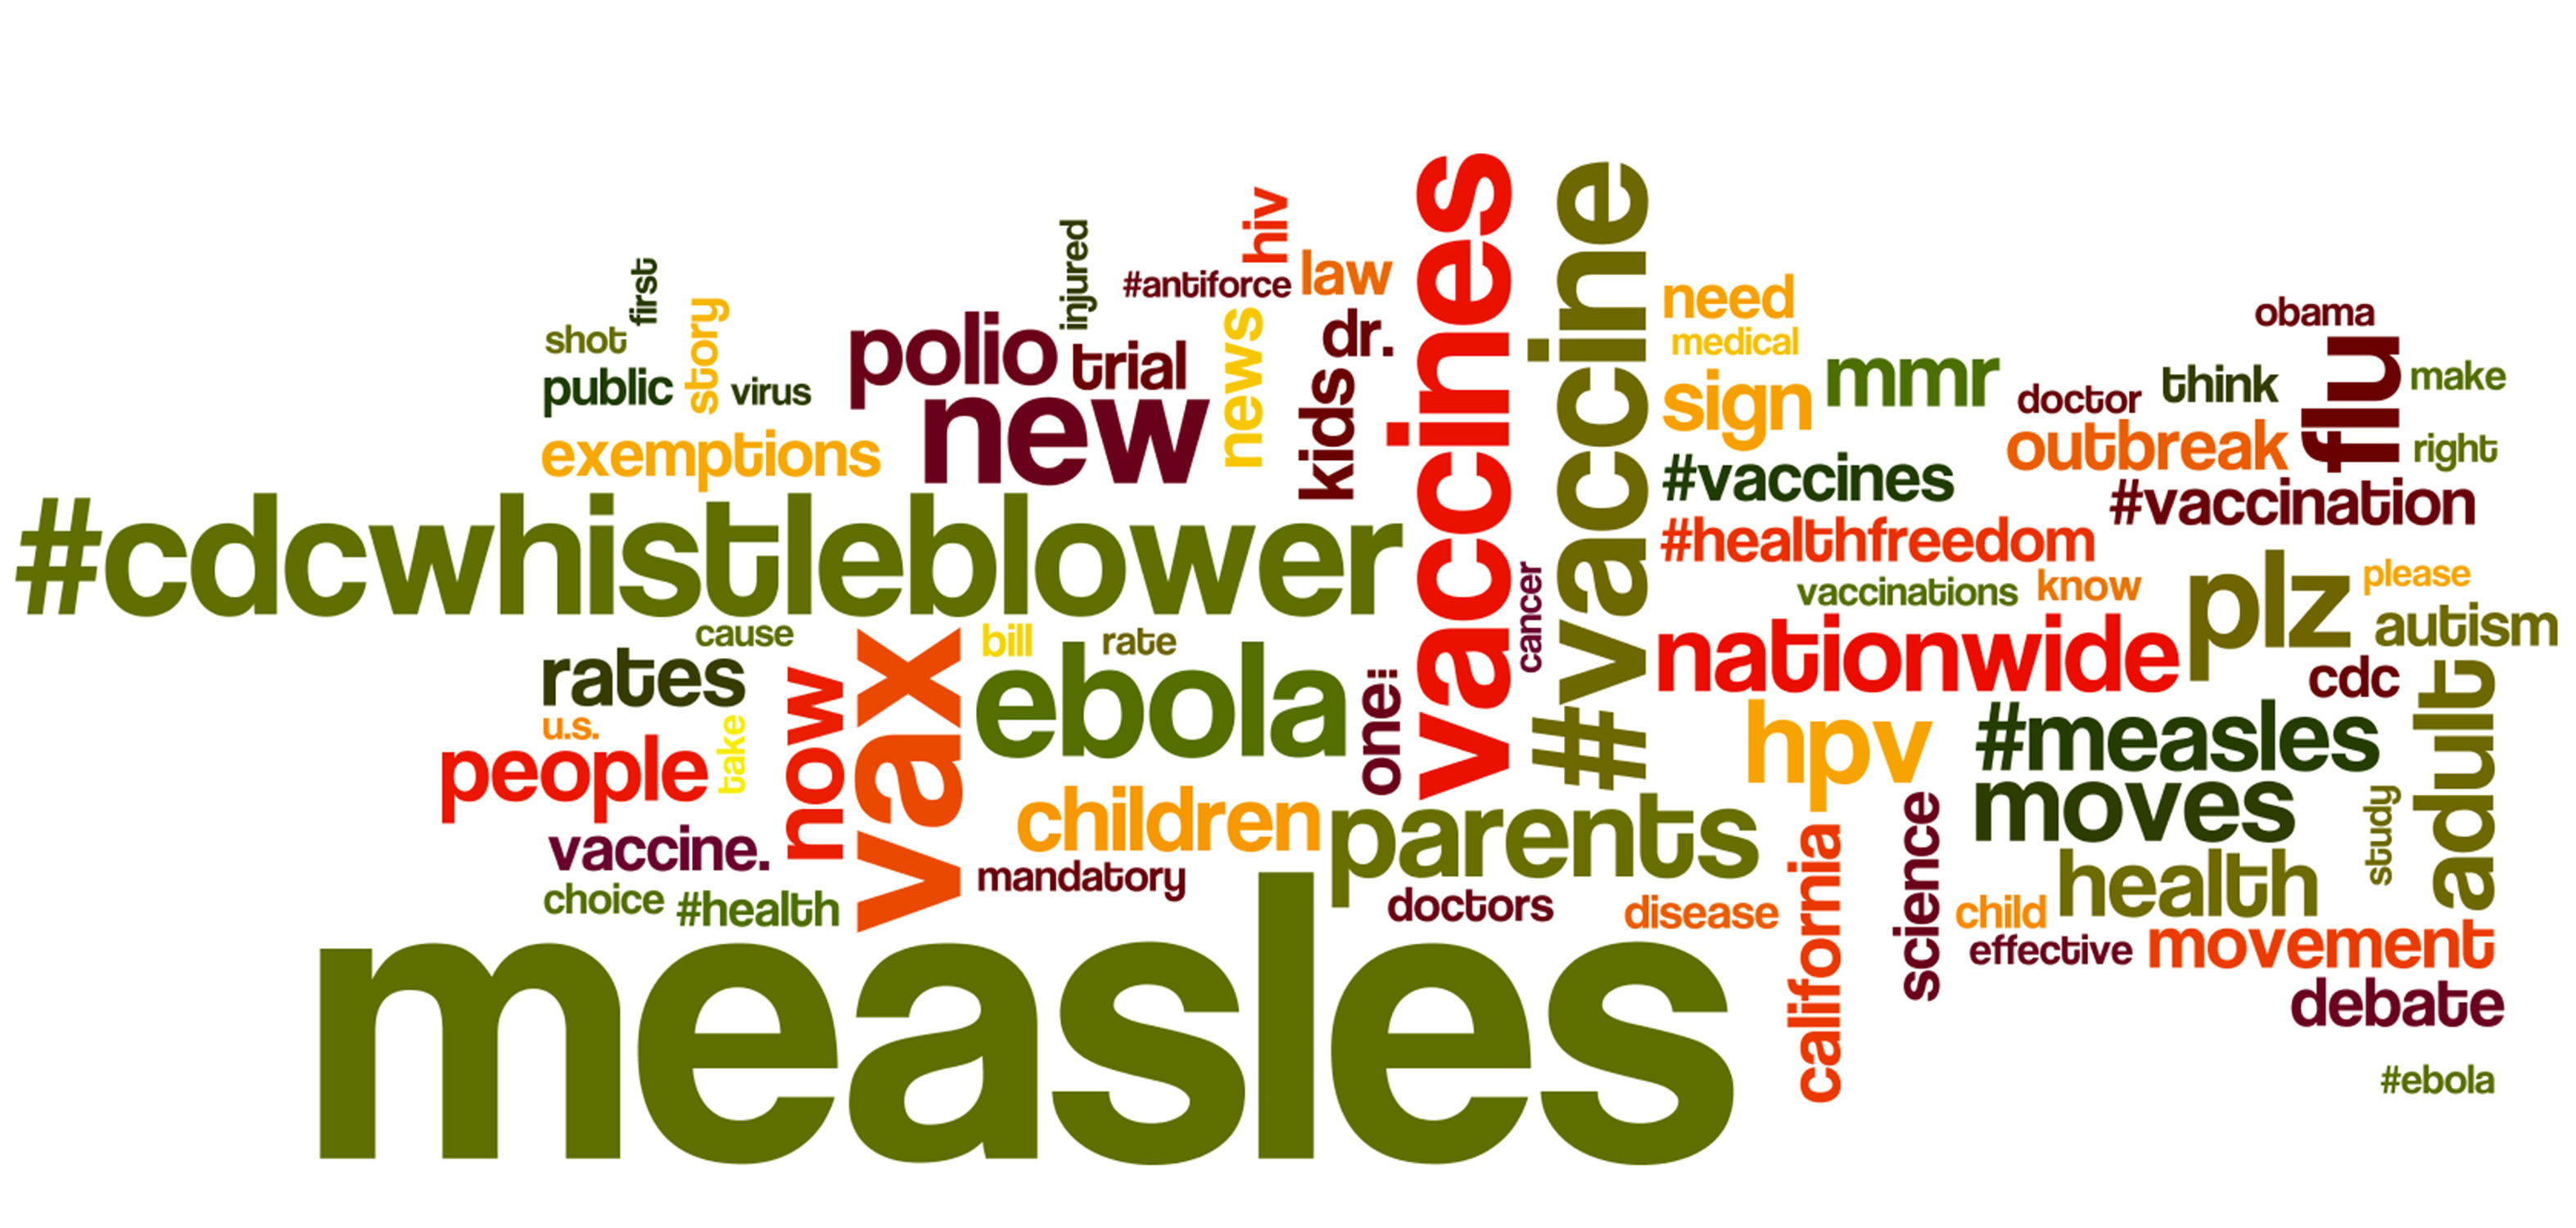
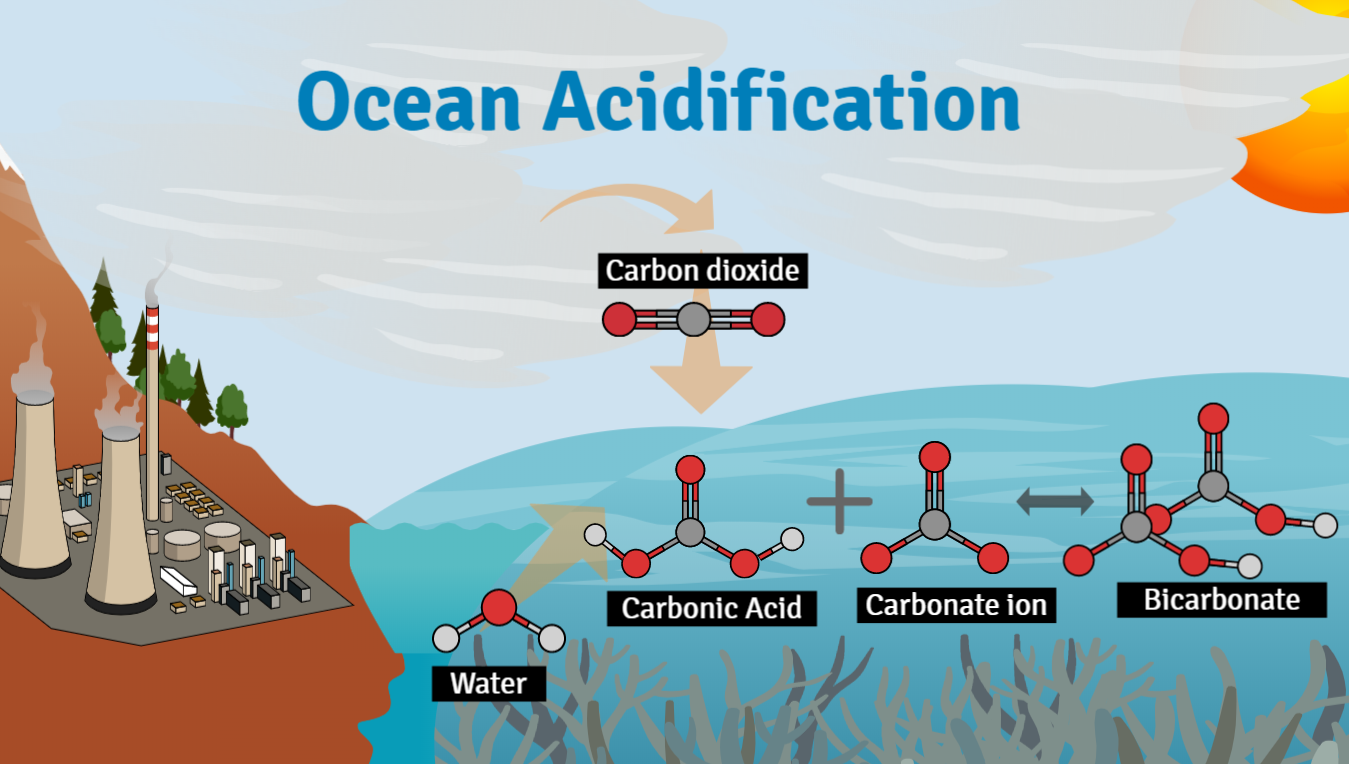
Klimatförändringarna är ett kontroversiellt ämne nuförtiden. Vi kan se förnekelse och skeptiska människor överallt på sociala medier. Men varje dag kommer forskare med nya data som ökar medvetenheten om konsekvenserna av våra vanor. Men är det verkligen människan som orsakar den globala uppvärmningen? Enligt vetenskapen, ja. Nu har tre studier publicerats i Nature [...]
Hej på er! Att vara forskare innebär att vara uppdaterad i allt som rör vetenskap. Ännu mer, [...]
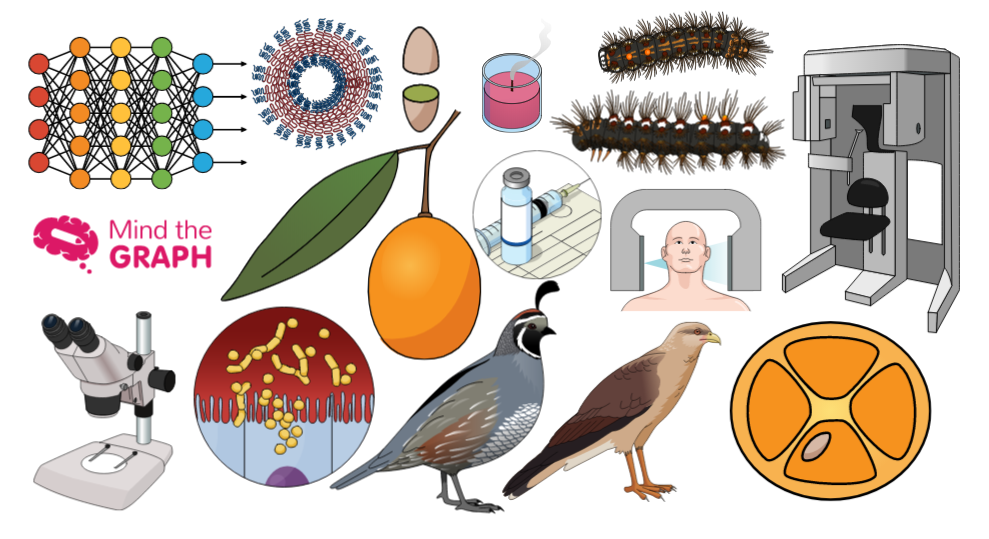
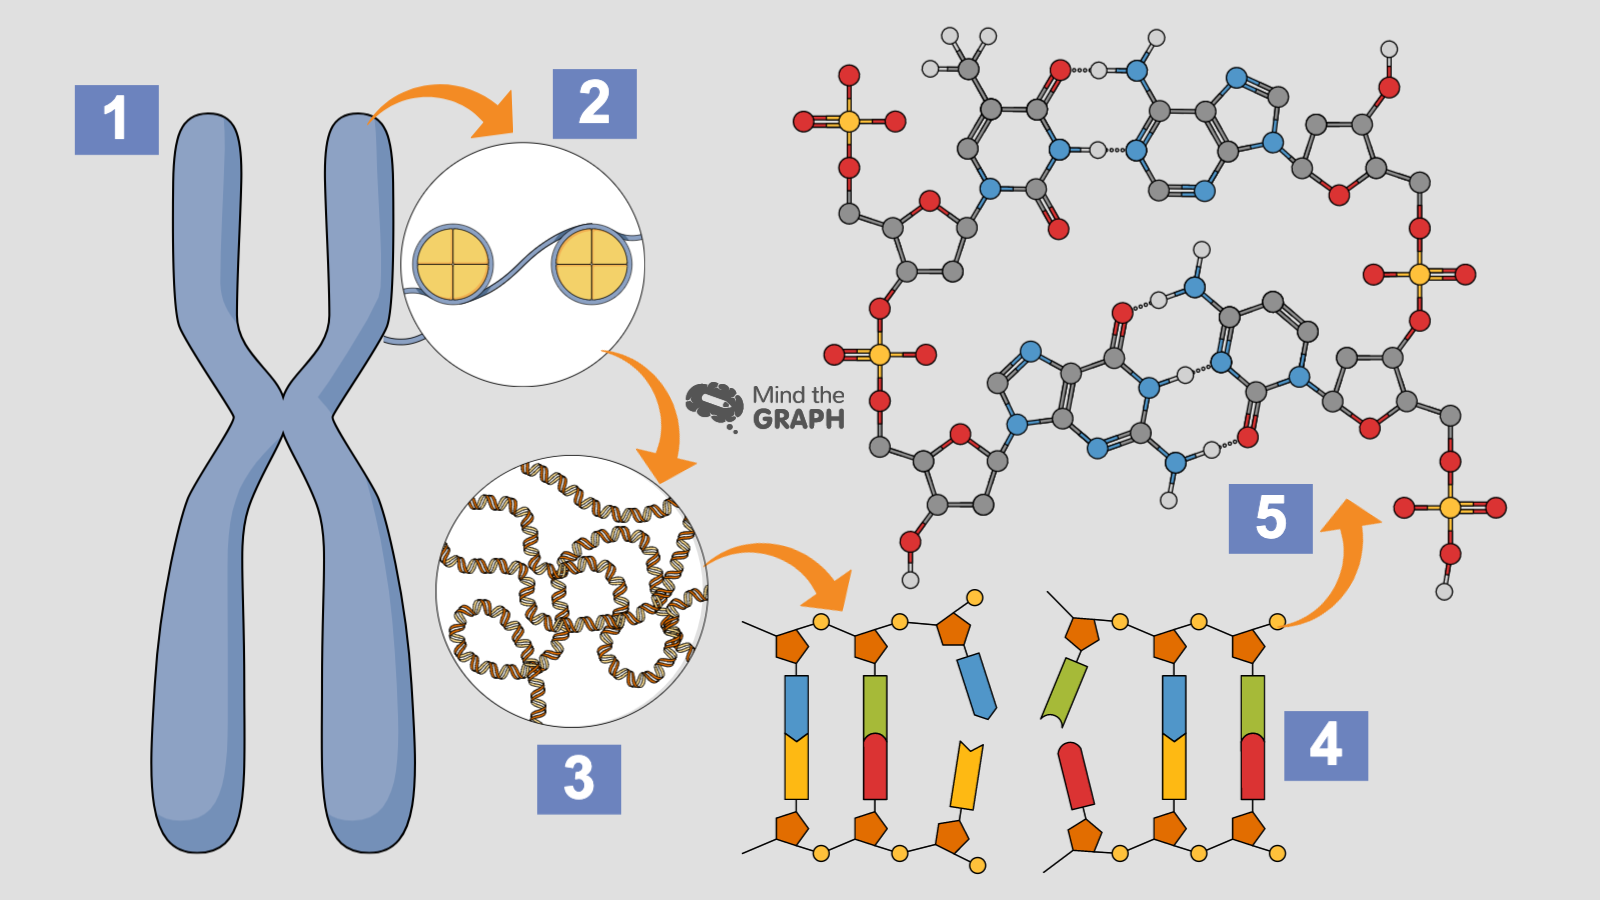
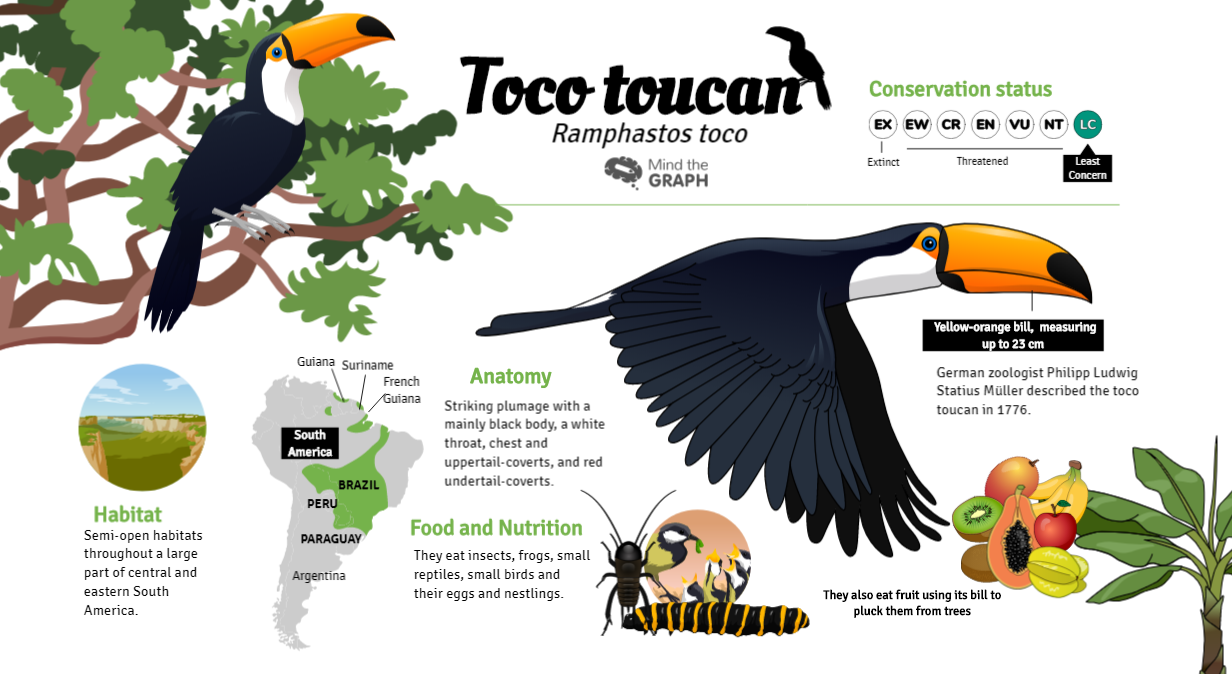
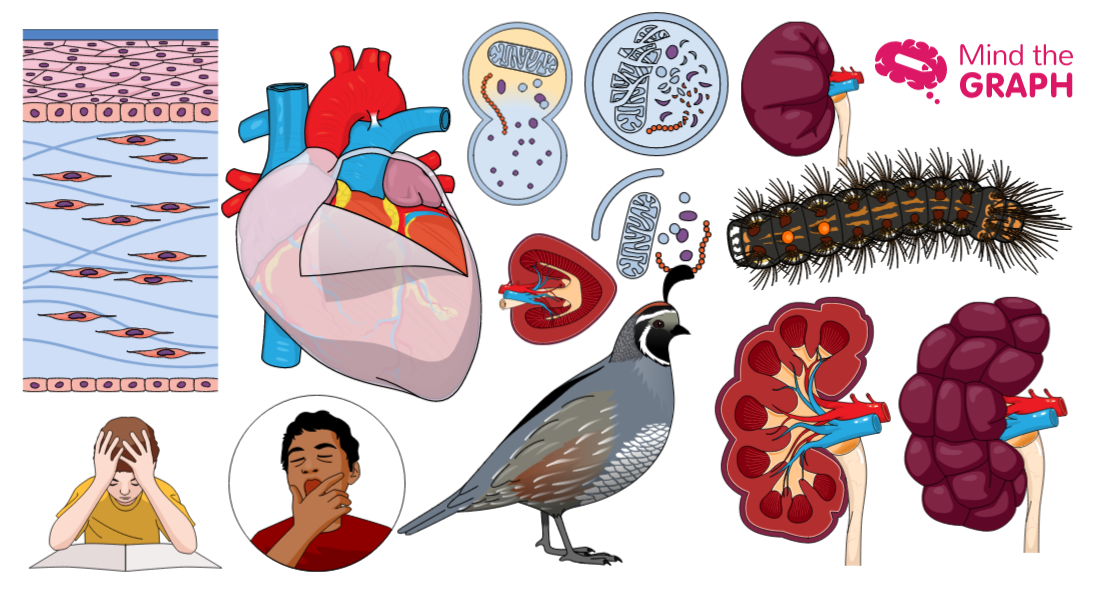
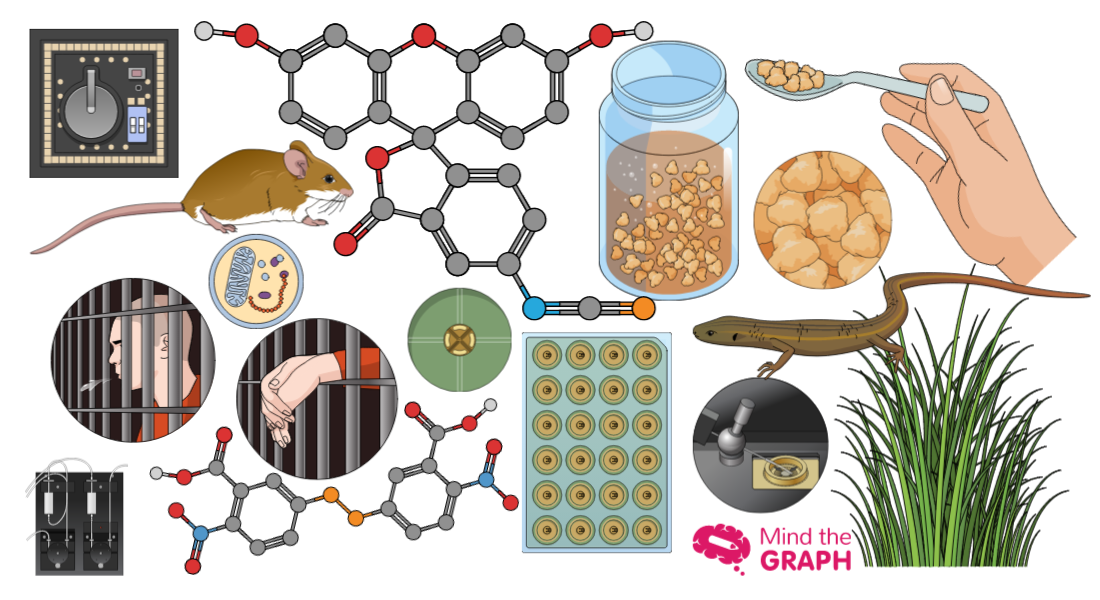
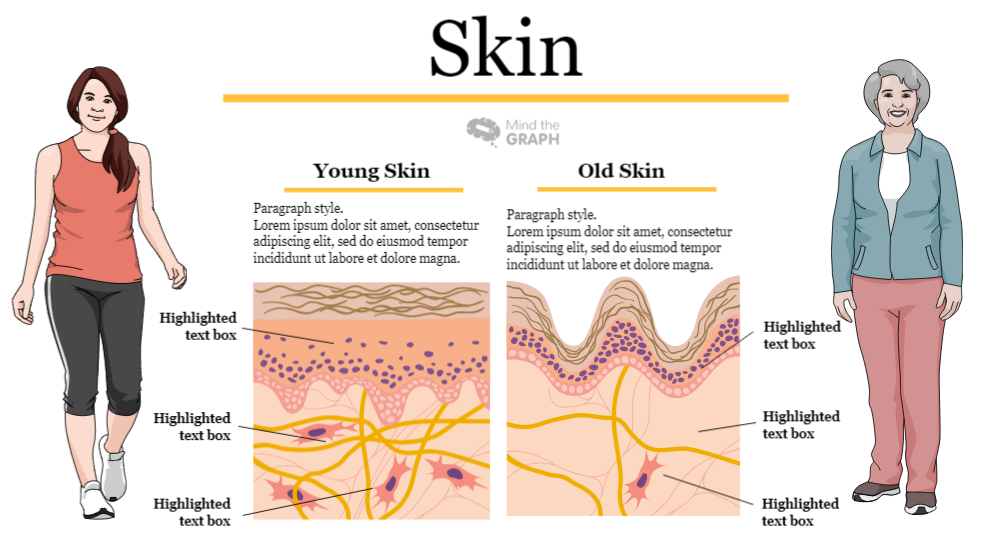
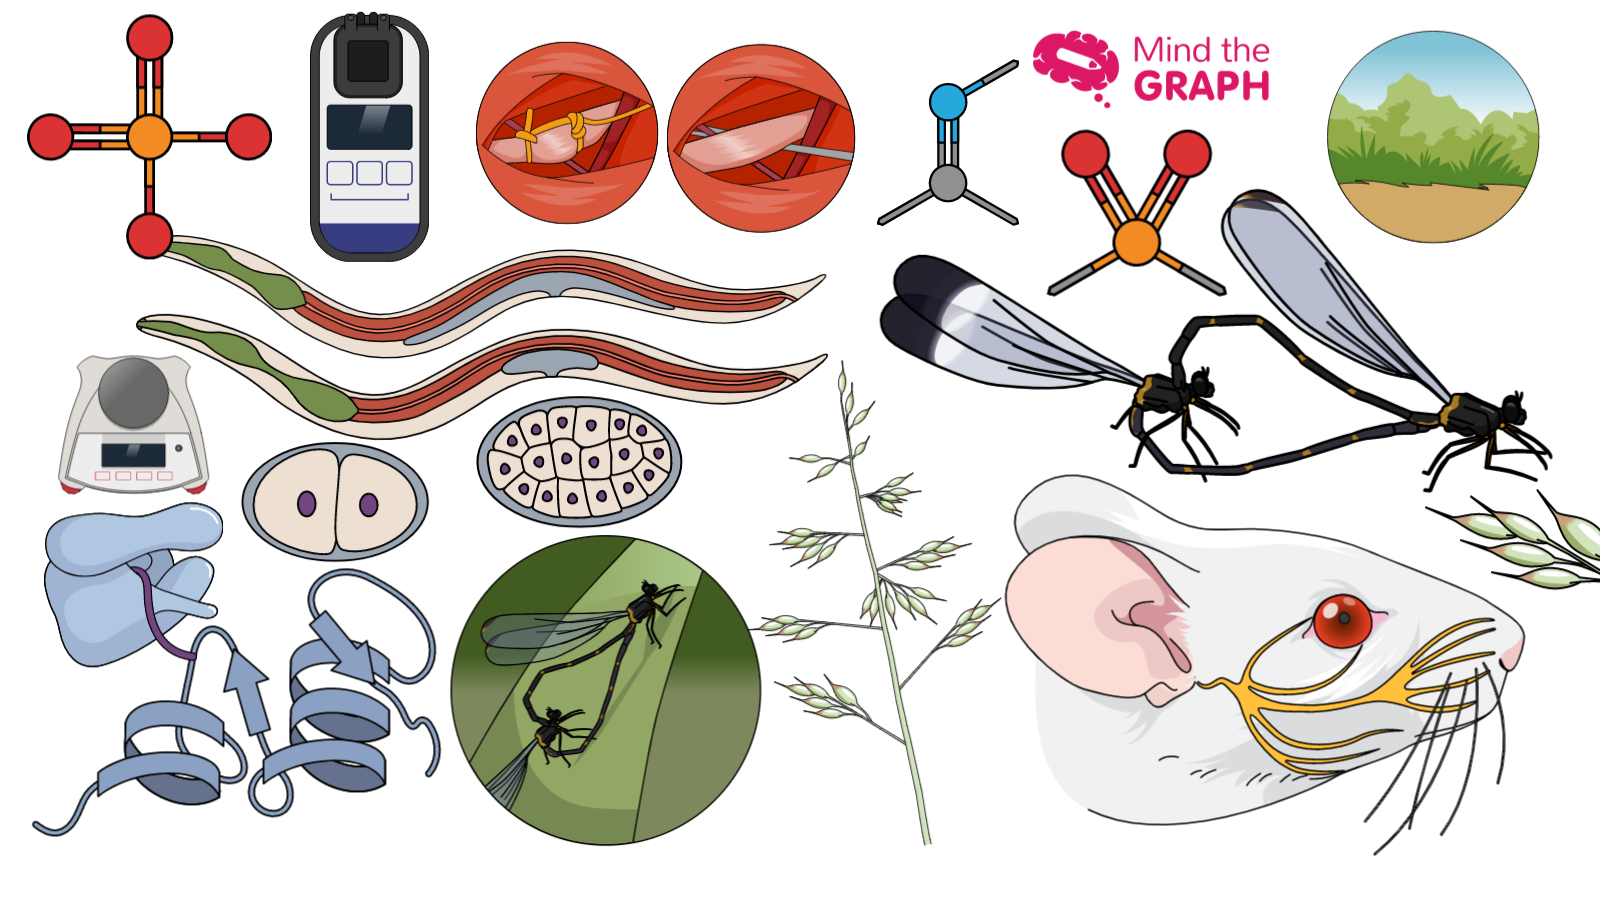
På fredag är det dags att visa upp våra nya vetenskapliga och medicinska illustrationer. Vi har redan [...]
Vetenskapen kan förändra världen. Detta innebär att vi som forskare har en enorm makt. [...]
Att fånga och behålla barns och tonåringars uppmärksamhet är ingen lätt uppgift. Men [...]
Om du är vetenskapsman, läkare, student eller forskare vet du att presentationer är [...].
På fredag visar vi upp våra nya vetenskapliga och medicinska illustrationer som gör det möjligt att [...].
Hej på er! Fredag är en dag för att visa de nya vetenskapliga illustrationerna. Den här veckan har vi lagt till flera [...]
Förklarar du vetenskap och komplexa vetenskapliga ämnen på ett begripligt sätt? Det är inte en [...].
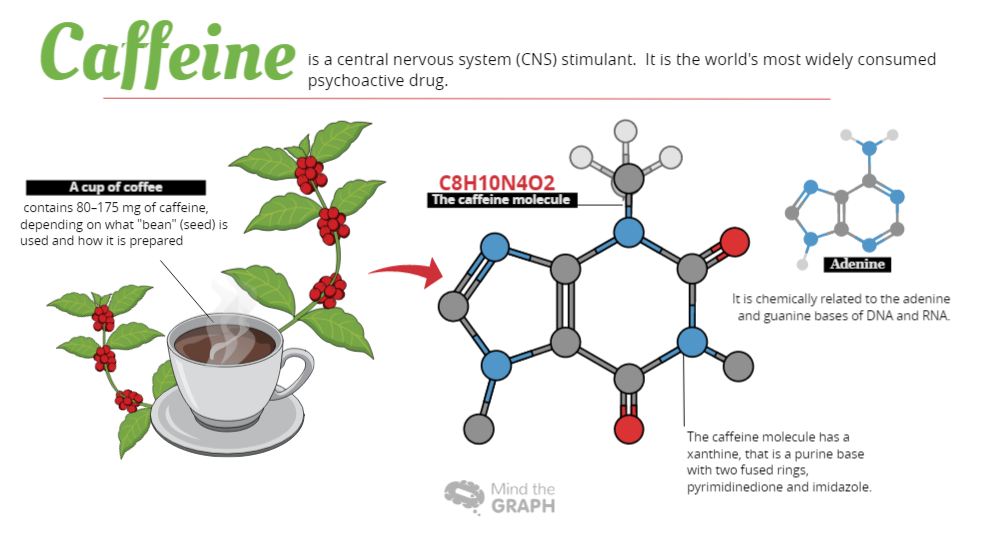
Tog du en kopp kaffe i morse? En del av en forskares sociala liv är [...].
Hej, det är dags att visa de nya Mind the Graph vetenskapliga illustrationerna. Vi har redan [...]
För att kunna förmedla betydelsen av vetenskap i vårt samhälle måste vi först kunna [...].
Como você sabe, todas as sextas-feiras compartilhamos as novas ilustrações que adicionamos no Mind the [...]