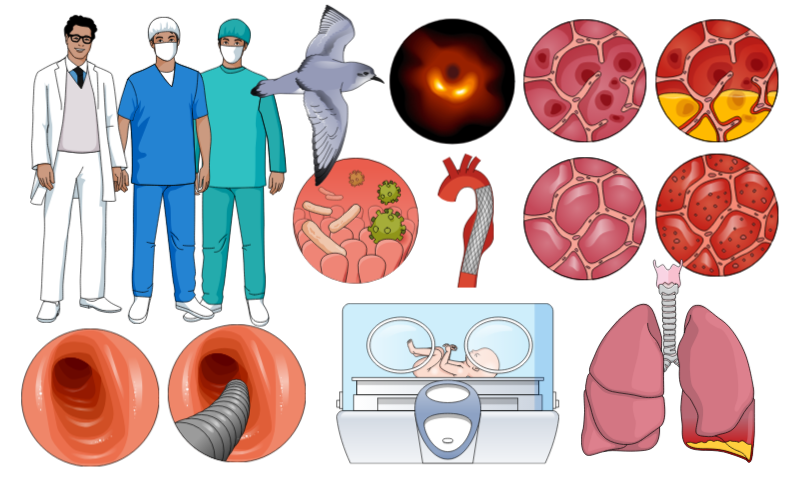
As you know, every week we add new scientific illustrations to our library on Mind the Graph. We already have over eight thousands illustrations now. Moreover, all them are available to all mind the graph users. Most of our illustrations are made by requests from our subscribers. So, if you are a subscriber, you can be om nye illustrasjoner at no extra cost. However, if you aren’t a subscriber yet, but you want to show your results in a visual way, don’t waste more time:
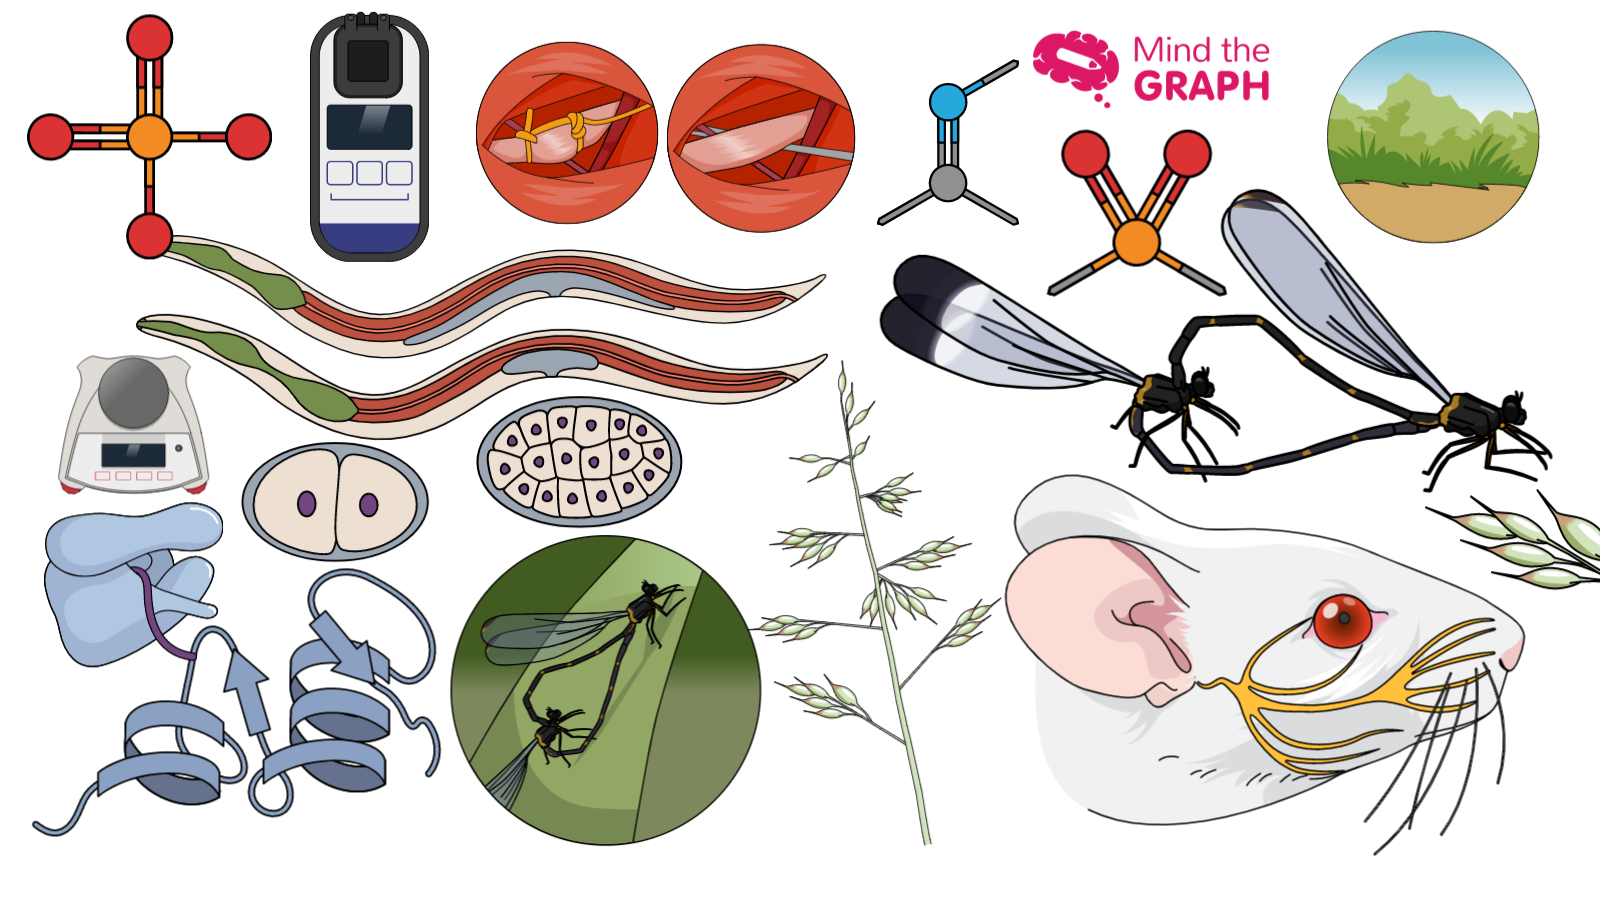
Ta en titt på ukens vitenskapelige illustrasjoner:
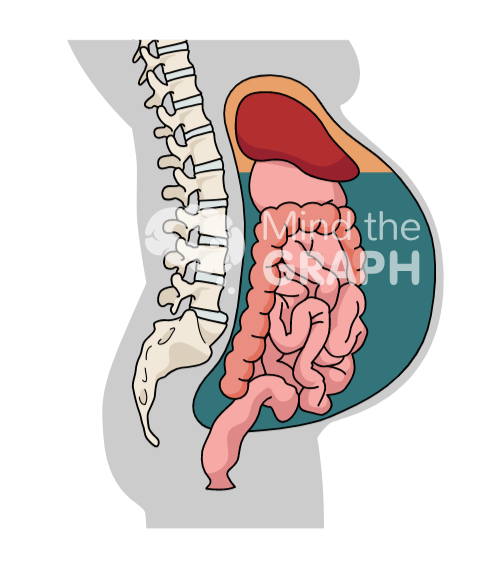
Ascitisk væske i peritonealhulen
"Illustrasjonene mine ser flotte ut, tusen takk! Kan jeg komme med et annet ønske? Jeg trenger en figur som viser opphopning av ascitisk væske i bukhulen hos pasienter med leversykdom."
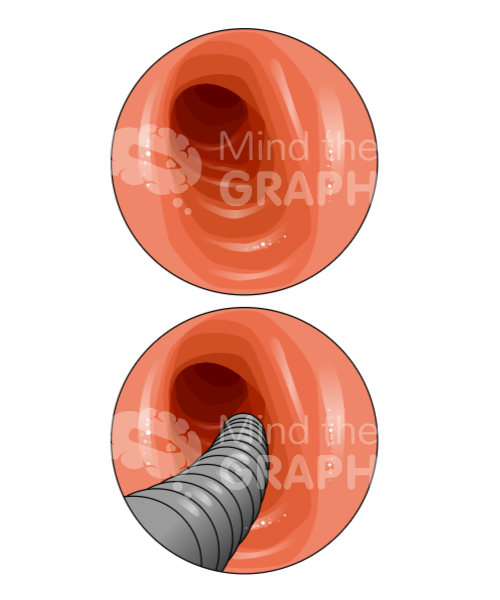
Prosedyre for endoskopi
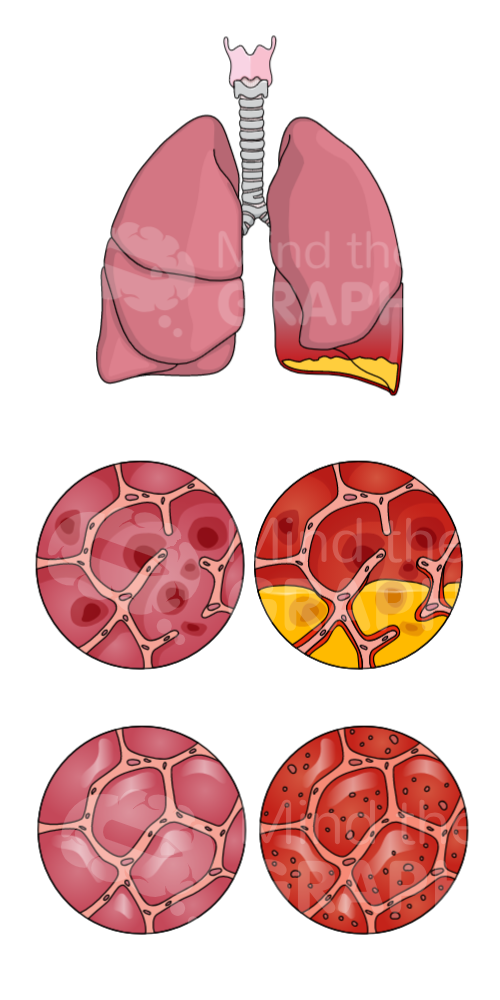
Disseminert/multifokal lungebetennelse
“Thank you for the pneumonia illustrations, I found them perfect for the paper I am writing.”
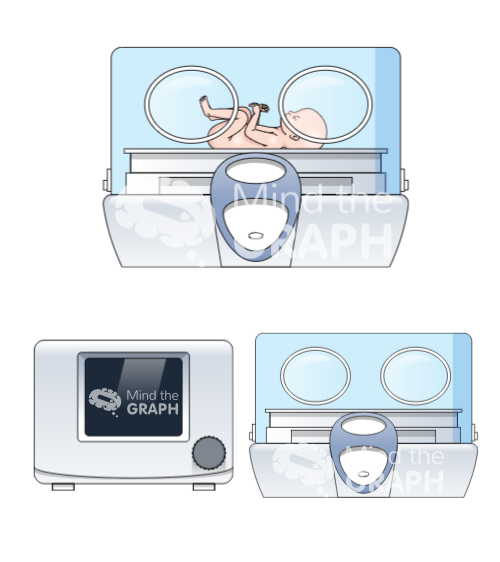
Kuvøser og monitorer for nyfødte
"Jeg jobber på en nyfødtintensivavdeling, og jeg vil sette pris på alle ikoner av nyfødte som er født til termin og for tidlig, kuvøser og monitorer."
Leger
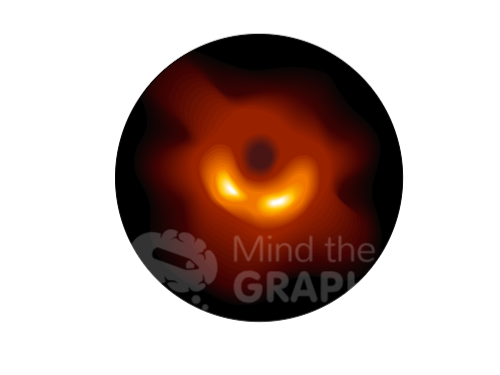
Svart hull
If you want to use these illustrations and have access to our library with thousands illustrations create your account on Mind the Graph. We offer a free plan so you can start today to create better graphical abstracts:

Abonner på nyhetsbrevet vårt
Eksklusivt innhold av høy kvalitet om effektiv visuell
kommunikasjon innen vitenskap.

