2 min læsning
04/08/2020
Mind The Graph Scientific Blog er beregnet til at hjælpe forskere med at lære, hvordan man kommunikerer videnskab på en ukompliceret måde.
Jeg har allerede en mening, men lad os gennemgå alle de tilgængelige teorier: 1) Den mest indlysende: sundhedssystemet i Tyskland er bedre rustet 2) Tyskerne bruger innovative behandlinger 3) Tyskland er stadig i udbruddets tidlige dage, så der var ikke "tid nok" til, at dødeligheden kunne stabilisere sig Og [...]
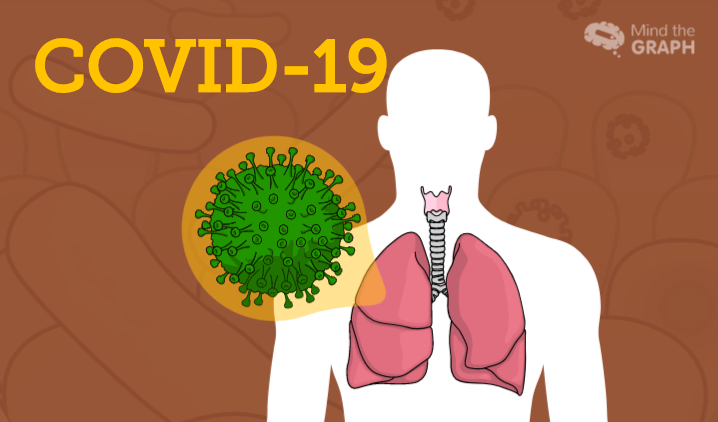
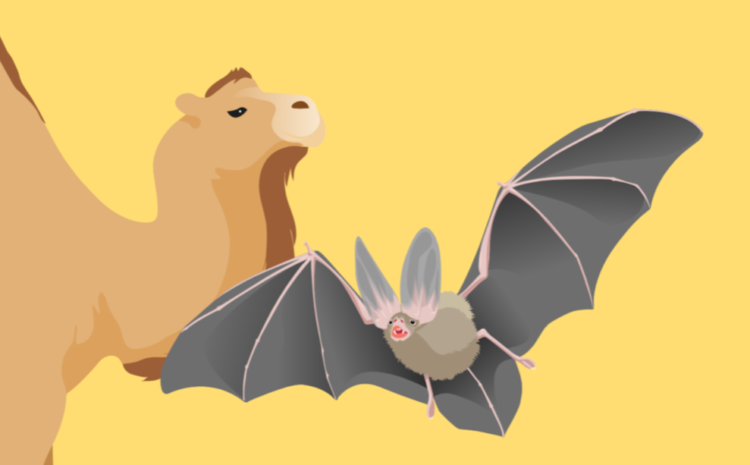
3) Fra det cellulære perspektiv genkender coronavirus-infektionsmekanismen ACE2-receptorer på [...].
Som vi nævnte i det allerførste indlæg i denne serie om coronavirus, er rytmen [...].
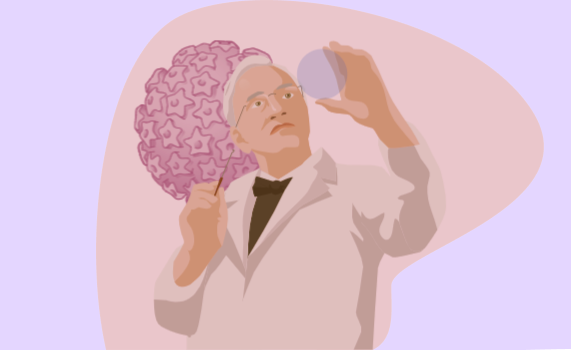
Historien om hans opdagelse er, at Fleming havde undersøgt stafylokokkernes egenskaber. [...]
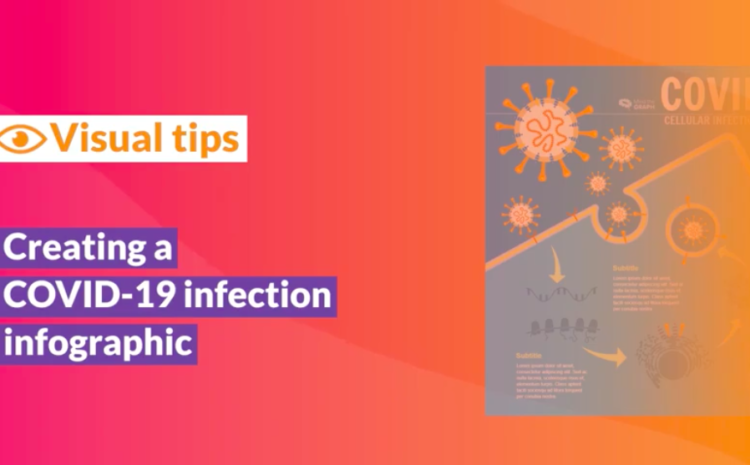
Verden står over for en stor sundhedskrise. Midt i den nye Coronavirus-pandemi, den første [...]
Hvis du har brug for videnskabelige tal, er det her stedet, vi har bogstaveligt talt tusindvis af videnskabelige [...].
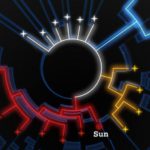
Dette er et spændende spørgsmål. Hvis du var en detektiv, der forsøgte at finde coronavirus [...]
På trods af at det samlede antal sager er nøjagtigt det samme, udjævner [...]