2 min læsning
06/12/2020
Mind The Graph Scientific Blog er beregnet til at hjælpe forskere med at lære, hvordan man kommunikerer videnskab på en ukompliceret måde.
Denne tutorial-video viser, hvordan du kan lave en videnskabelig plakat i Mind the Graph, ligesom prisvindende videnskabelige plakater. Du behøver ikke at starte helt fra bunden. Dermed bliver det lettere at skabe noget prangende og interessant til at kommunikere din forskning og bruge mindre tid. Vi gør forskere til designere for at øge deres gennemslagskraft! Lær i [...]
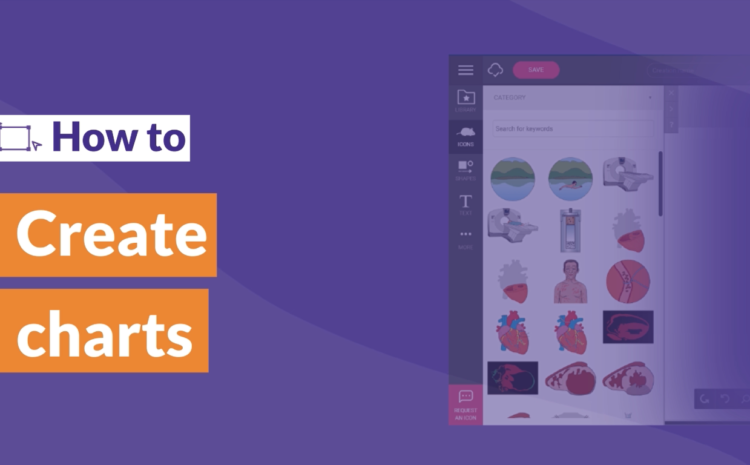
Denne tutorial-video viser, hvordan du kan lave videnskabelige diagrammer i mind the graph. Du [...]