How to create a graphical abstract for Springer
Graphical abstracts for Springer After a long time studying and working in a lab you […]
Get quick and useful tips about Mind the Graph tool, research paper publishing, and other science related subjects.
Graphical abstracts for Springer After a long time studying and working in a lab you […]
Today we have a guest author – Maryam Kamal – who is a font duos designer […]
Discover how to create an effective graphical abstract. This guide helps you craft a compelling visual summary to enhance research impact.
As you probably know at this point, we are have the biggest library of accurate […]
Are you explaining science and complex scientific topics in an understandable way? It isn’t an […]
As you probably know, Mind the Graph is an online platform that allows scientists to […]
Mind the Graph é uma plataforma com milhares de ilustrações científicas que permite criar resumos […]
It is common to use two or three different species in a experiment. Besides that, […]
Many scientific maganizes already request a graphical abstract to publish a paper and others suggest […]
If you are a teacher or if you present your data in scientific congress you […]
Mind the Graph is an online platform that allows scientists to create graphical abstracts and […]
How to empower your research in Life Sciences with graphical abstracts? It isn’t easy to […]
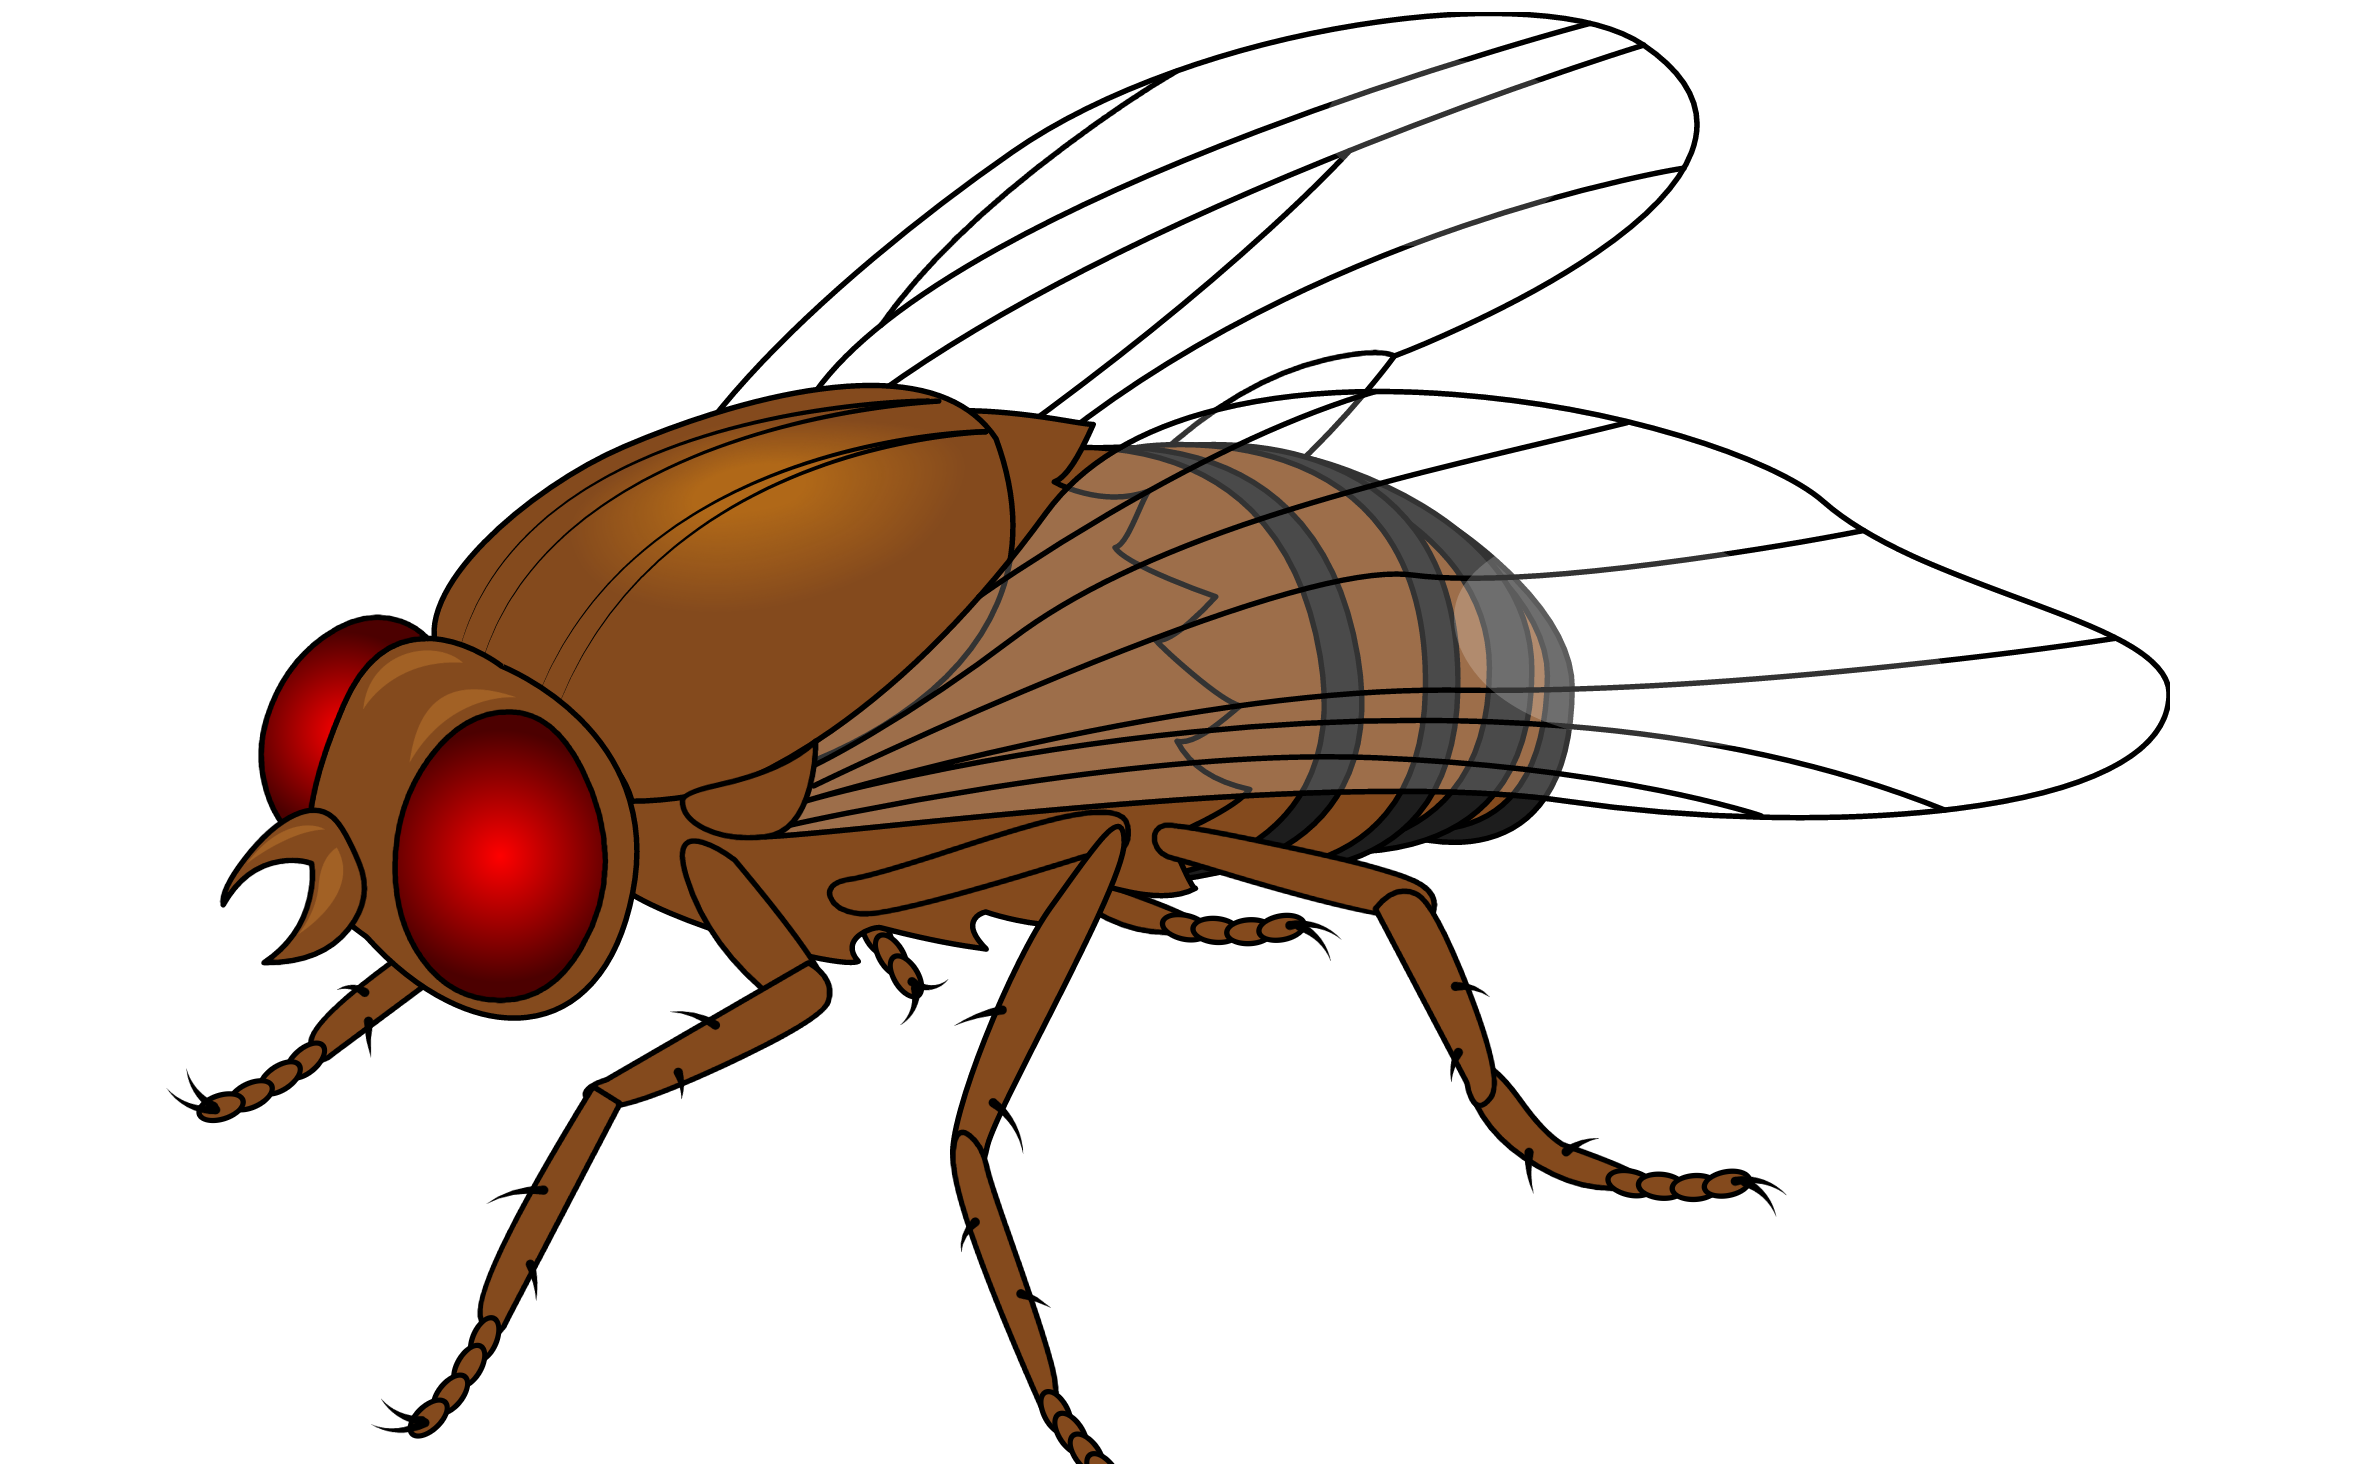
Drosophila melanogaster or fruit flies are one of the most important models in medical and […]