Find thousands of medical illustrations on Mind the Graph
As a doctor, you probably know the importance of communicate well with your patients. They […]
As a doctor, you probably know the importance of communicate well with your patients. They […]
Hello, it’s friday again (YAY) and it’s time to see the new scientific illustrations of […]
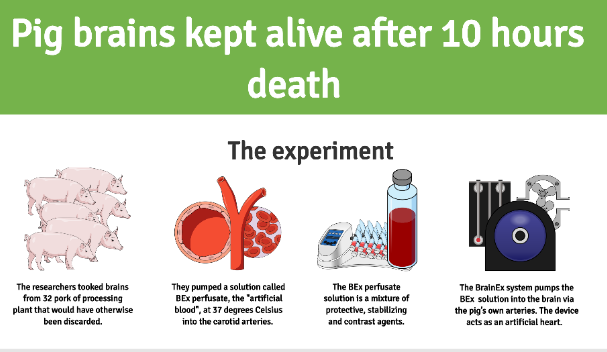
Scientists from Yale University kept pig brains alive outside body for hours after death. The […]
Mind the Graph Templates If you are a user already, you know that the Mind […]
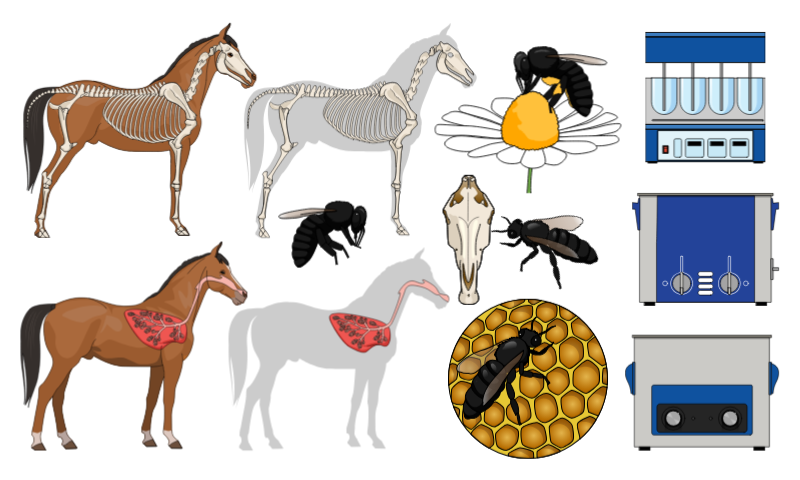
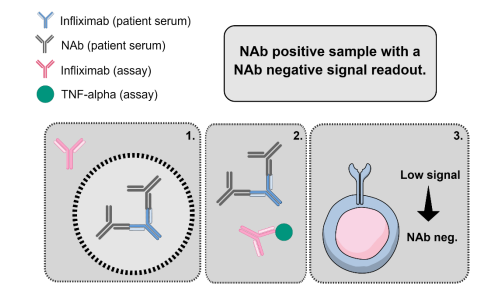
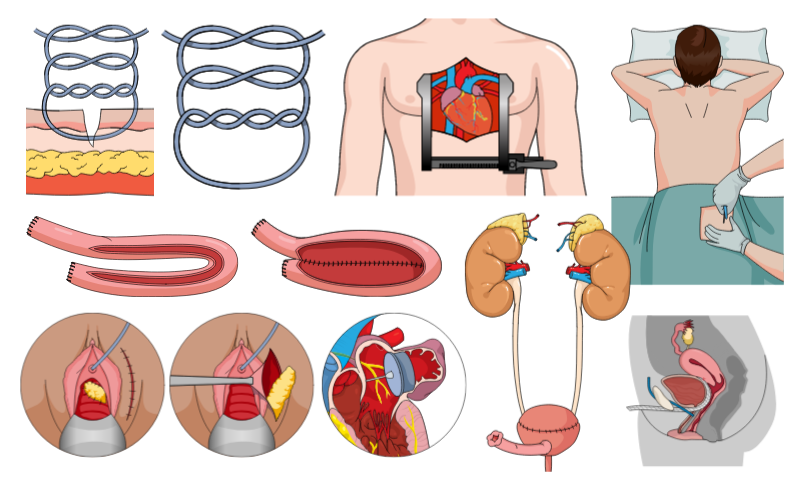
It’s time to show you the new scientific illustrations that we created this week. Every […]
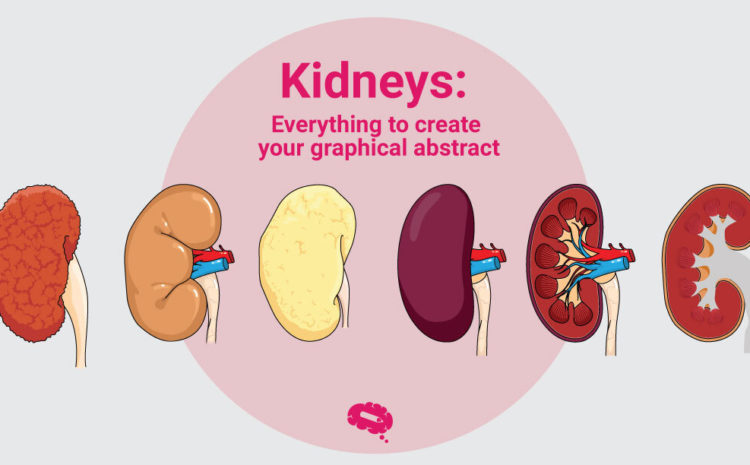
Hello! As you know, we add new scientific illustrations every week in Mind the Graph. […]
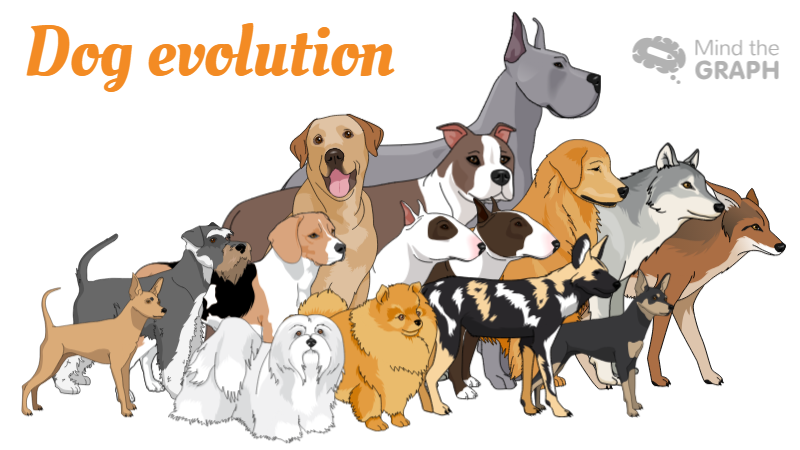
Dogs are people’s best friends and they evolved close to us when wolves and humans were […]
We always love to show off our users amazing work. Empower scientists to enable a […]
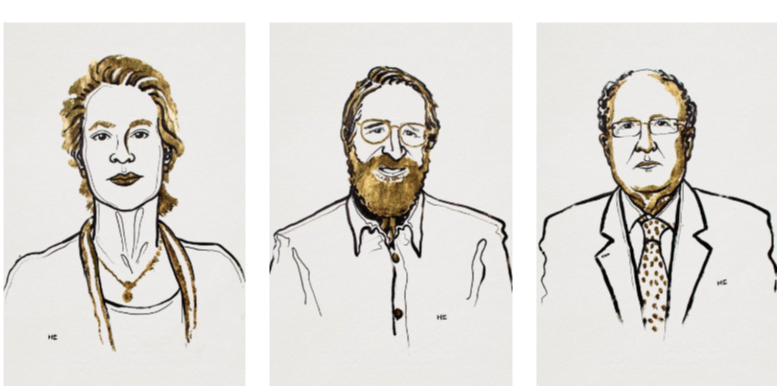
The 2018 Nobel Prize was announced this month and brought exciting science news. We select infographics […]
Sometimes, I receive e-mails from scientists, engineers, teachers and other professionals saying: Oh, I love […]
Somos uma plataforma online para cientistas que desejam criar resumos gráficos, apresentações e infográficos. Com […]
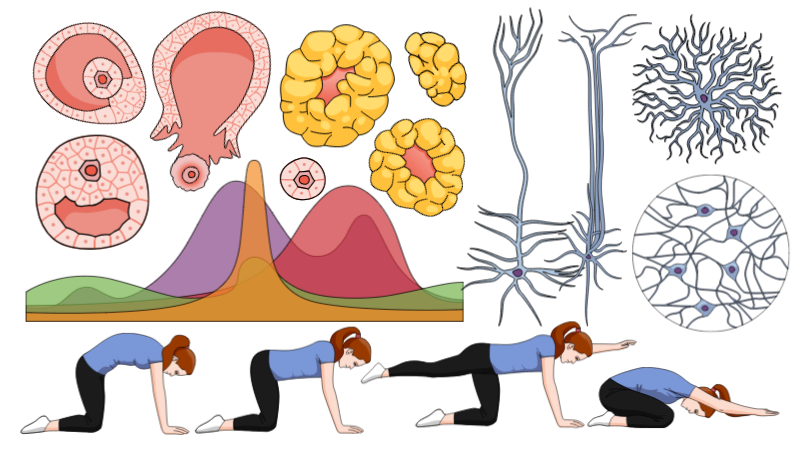
It is mother’s day in several contries around the world and we want to celebrate […]
This is the fifth post in the series How to make an infographic. If you […]