#21 New scientific and medical illustrations available
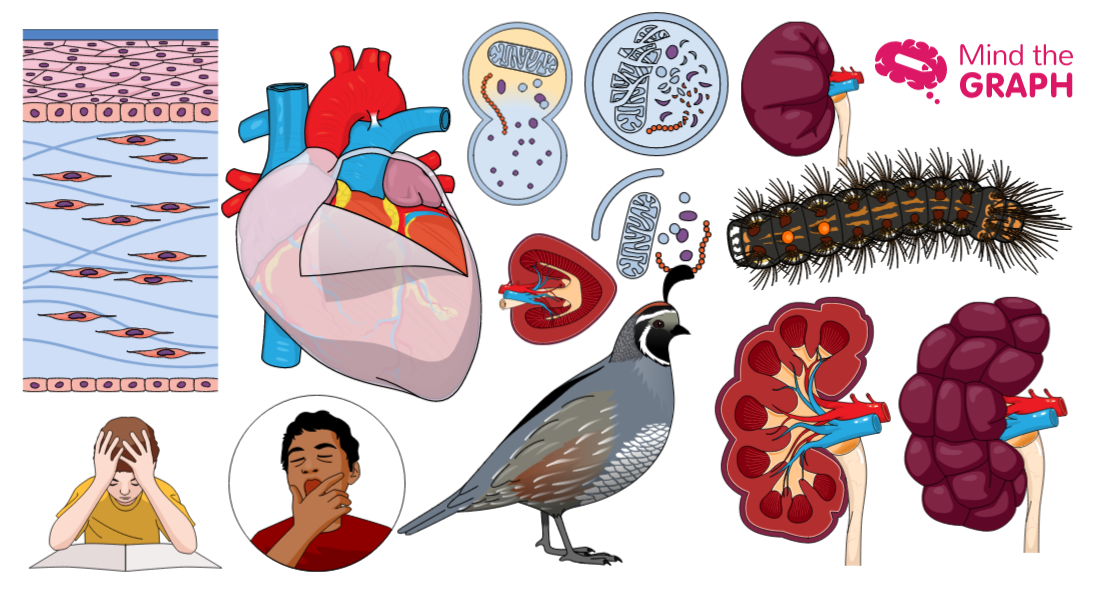
Friday is the day we show off our new scientific and medical illustrations that allows […]
Friday is the day we show off our new scientific and medical illustrations that allows […]
Olá! É sexta-feira novamente (YAY). Você está correndo para o fim de semana? Ou você […]
It is always amazing to show the scientific work of our users. So, today I will […]
It is time to show the new Mind the Graph scientific illustrations. As you know, […]
Nothing is so good that it can’t be better, am I right? The last weeks […]
Mind the Graph é uma plataforma com milhares de ilustrações científicas que permite criar resumos […]
It’s friday again (YAY), so it’s time to see the new scientific illustrations of the […]
Carbon dioxide is a common gas present in the atmosphere. Normally, the Earth’s carbon cycle […]
É hora de ver as ilustrações científicas que adicionamos à plataforma Mind the Graph na […]
It is time to show the new Mind the Graph scientific illustrations. As you know, […]
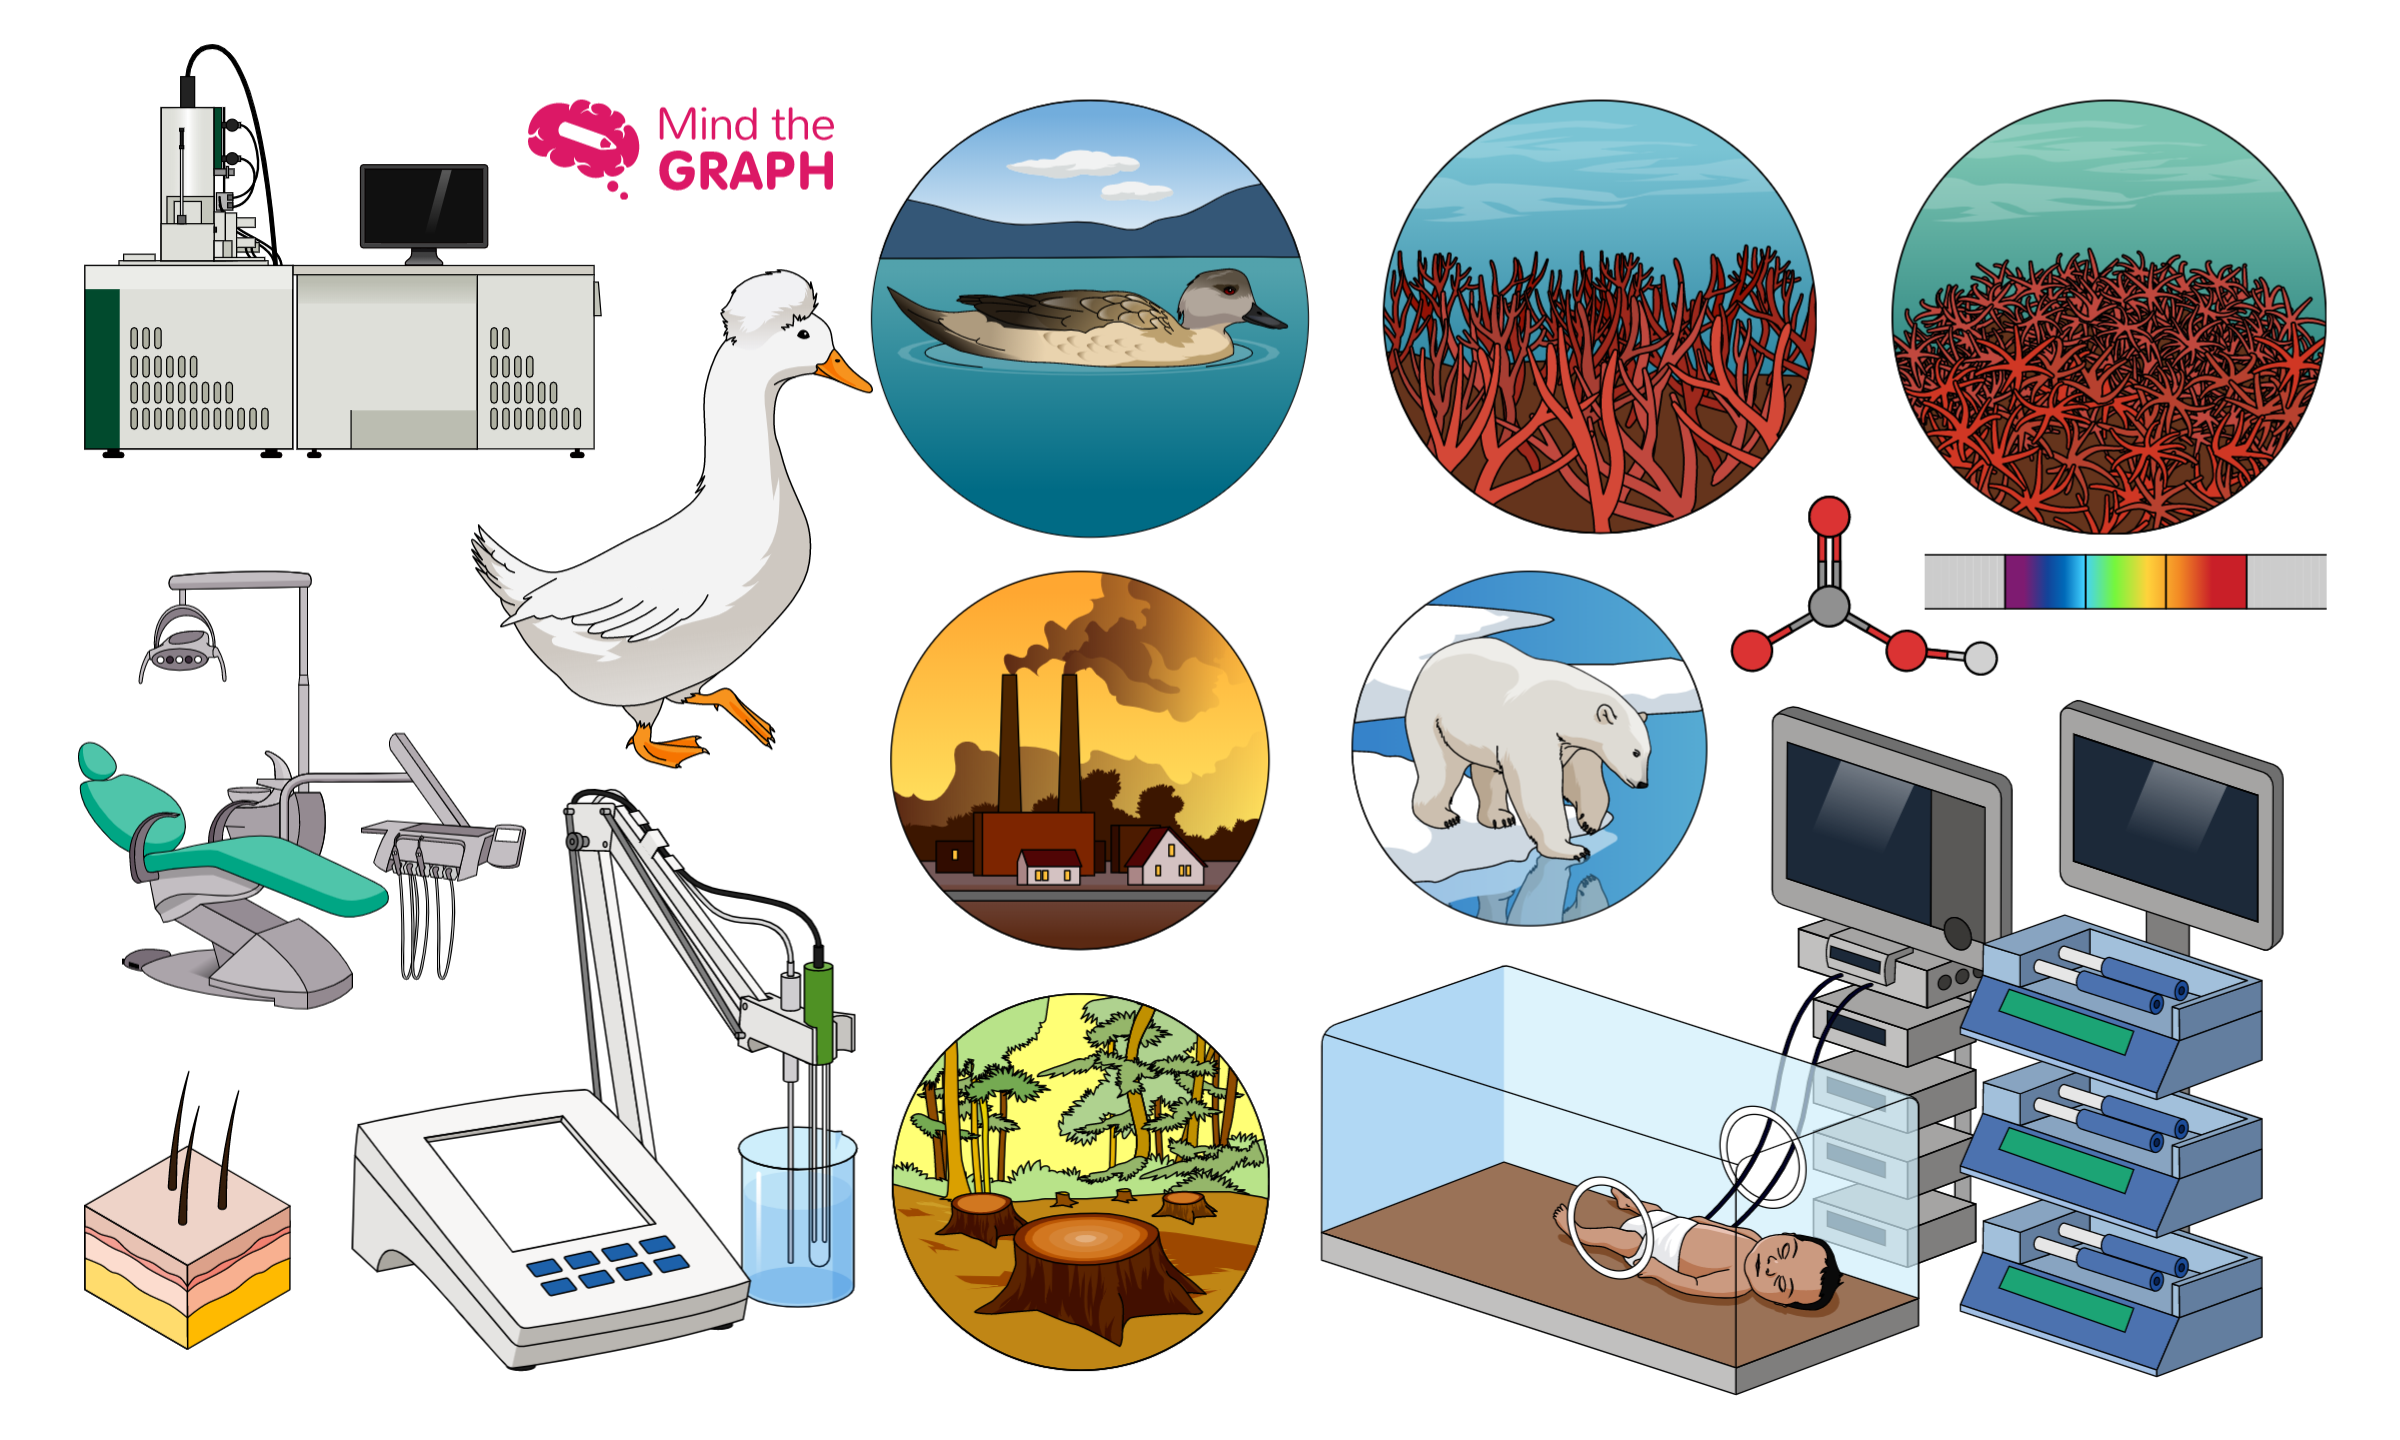
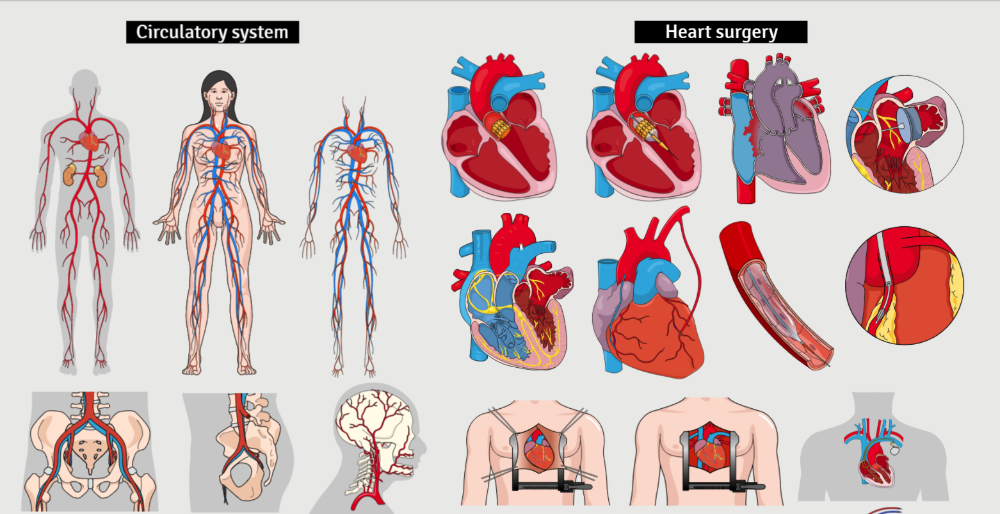
Images of circulatory system diseases like heart lesions are very useful for patient and parent […]
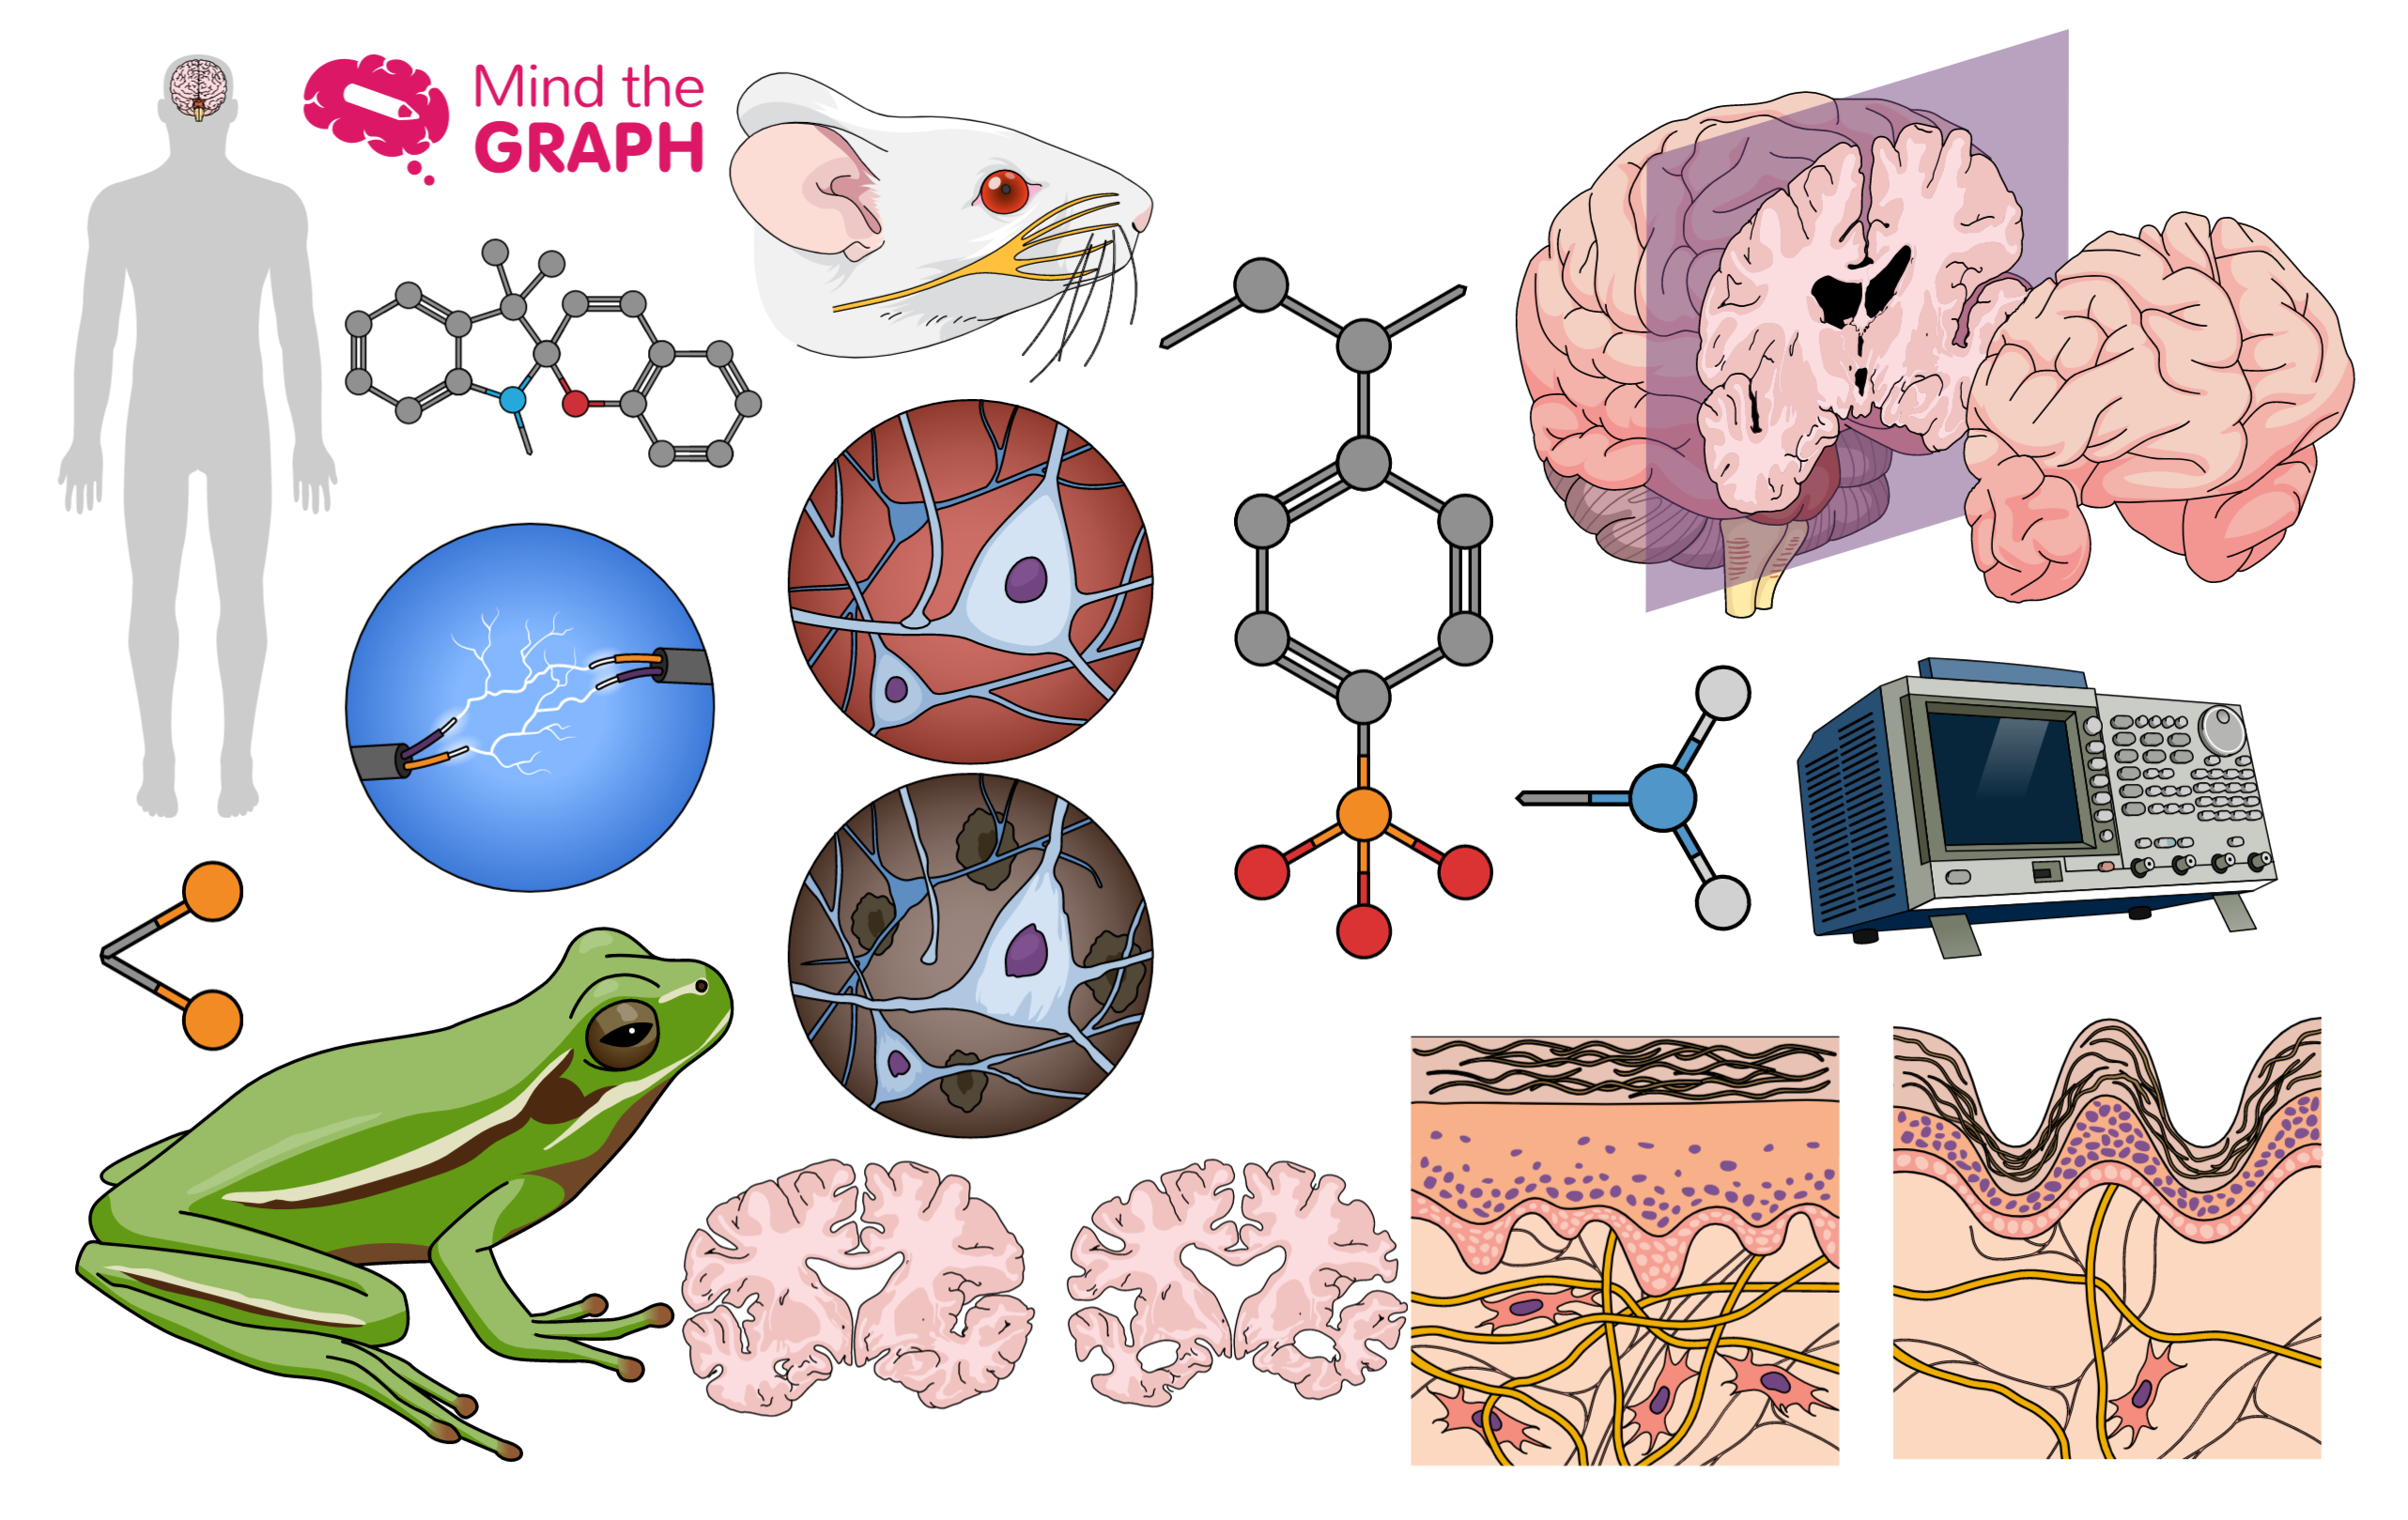
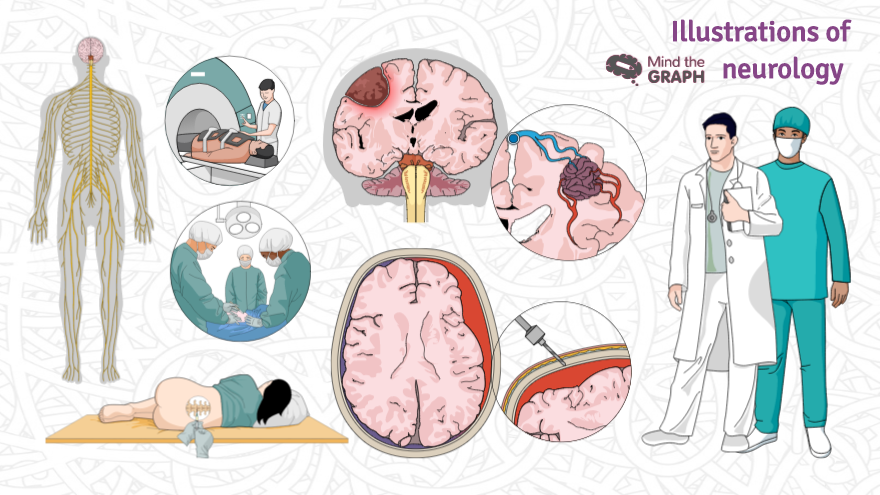
Os distúrbios neurológicos são doenças do cérebro, da coluna e dos nervos que os conectam. […]
Many scientific maganizes already request a graphical abstract to publish a paper and others suggest […]