5 min läsning
06/08/2021
Den vetenskapliga bloggen Mind The Graph är tänkt att hjälpa forskare att lära sig hur man kommunicerar vetenskap på ett okomplicerat sätt.
En stor del av en forskares vardag består av att utforma och utföra experiment. Kombinationen av laboratorietekniker svarar på de flesta av forskarnas frågor, och arbetsflödet för att föreslå nya metoder beror på forskarens bakgrund och erfarenhet. För biologer kan cellbilder säga en hel del om vad som händer med [...].
Under en period av ett år har världen förändrats för alltid. COVID-pandemin ger [...]
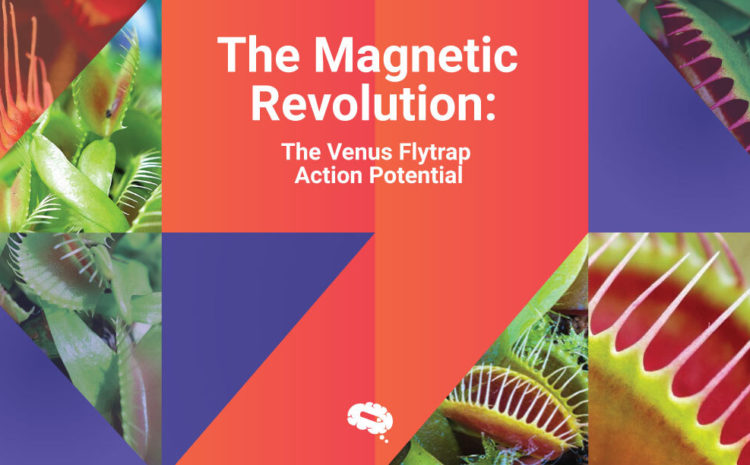
Dionaea muscipula, populärt känd som Venus flugfälla, är en köttätande växt som fångar sitt byte [...].
Välkommen till Mind the Graph-upplevelsen! Detta är den första artikeln i en serie [...]
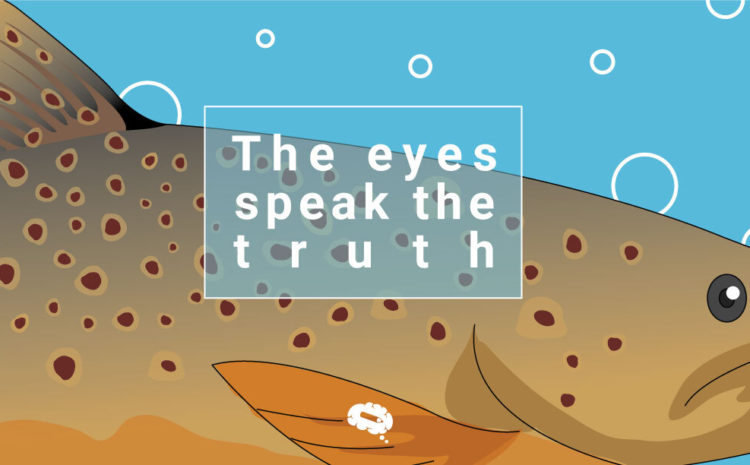
Det stämmer, alla svar ligger i ögonen. Även när det gäller [...]
Oavsett om du är en professor med ansvar för ett forskningslaboratorium eller en forskare som är en del av [...].
Som forskare är vi alla vana vid en traditionell struktur av vetenskapliga publikationer och vetenskapliga [...].
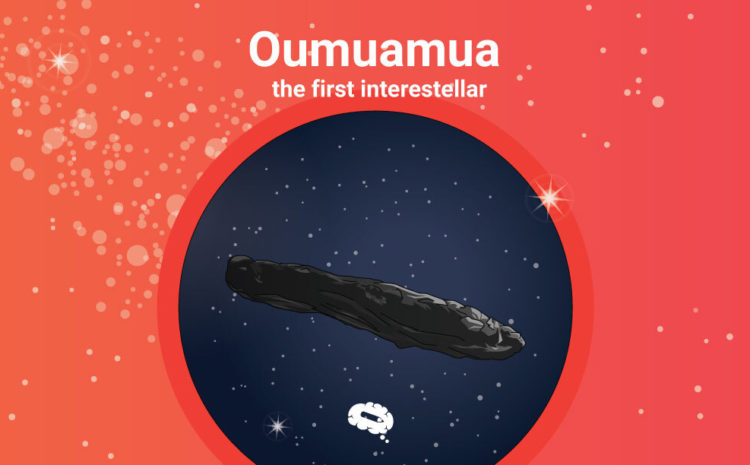
För lite mer än tre år sedan dök ett konstigt föremål på himlen 2017 upp. [...]
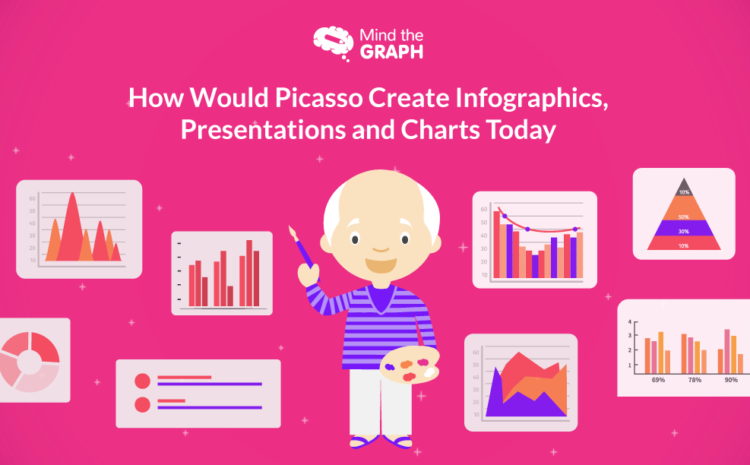
Har du hört talas om Guernica? Den gråtande kvinnan? Eller flickan med mandolinen? Dessa är några [...]
Vill du veta hur du får dina forskningsrapporter att sticka ut med hjälp av diagram och grafer? Då är den här bloggen vad du behöver. Läs den nu!
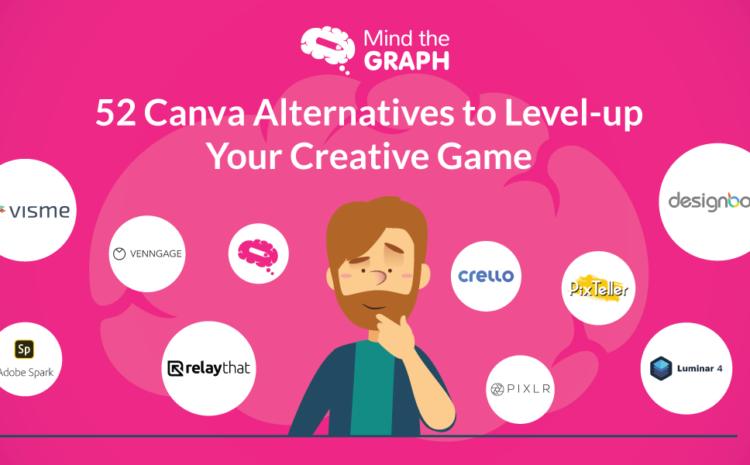
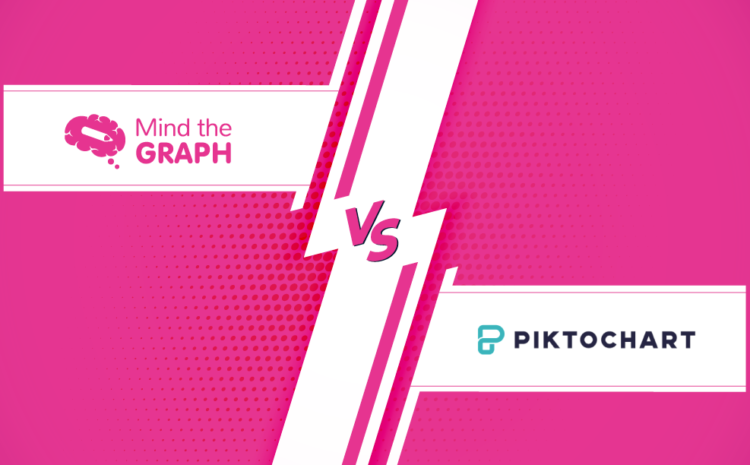
Canva är säkert ett av de bästa verktygen för grafisk design som vi har på webben. [...]
Visuellt material som infografik och presentationer är ett utmärkt verktyg för innehållsmarknadsföring. De kan dock [...]
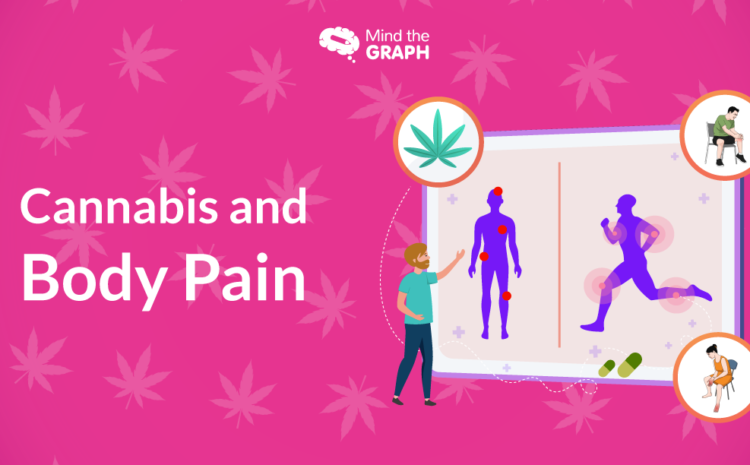
Under det senaste årtiondet har många kliniska prövningar rapporterat positiva och lovande resultat i [...].