4 min läsning
05/15/2019
Den vetenskapliga bloggen Mind The Graph är tänkt att hjälpa forskare att lära sig hur man kommunicerar vetenskap på ett okomplicerat sätt.
Vetenskap måste handla om nyfikenhet och frågor, inte om dogmer och färdiga svar. Så lärare behöver mer än att undervisa mot teorin om den platta jorden. Vi måste lära ut den vetenskapliga metoden att ställa hypoteser, göra experiment för att utforska observationer och svara på frågor. En fysiklärare, Rhett Allain, skrev om hur man lär ut den heliocentriska teorin, eller med andra ord, [...]
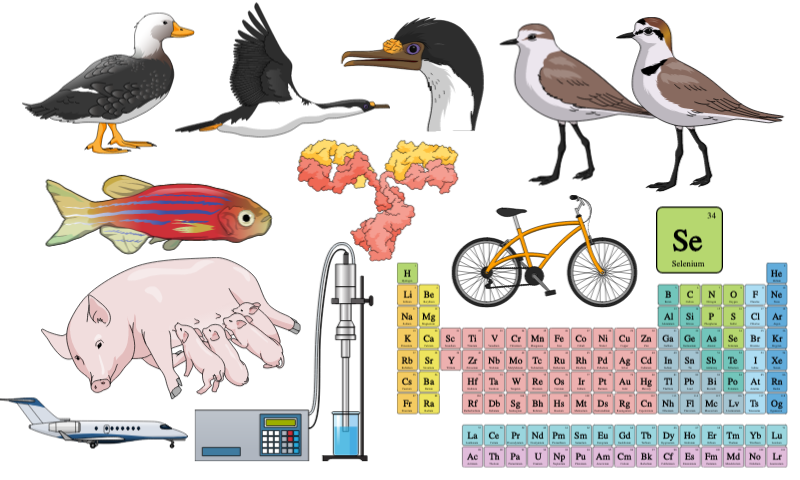
Det är dags att visa de nya vetenskapliga illustrationerna från Mind the Graph. Som ni vet är [...]
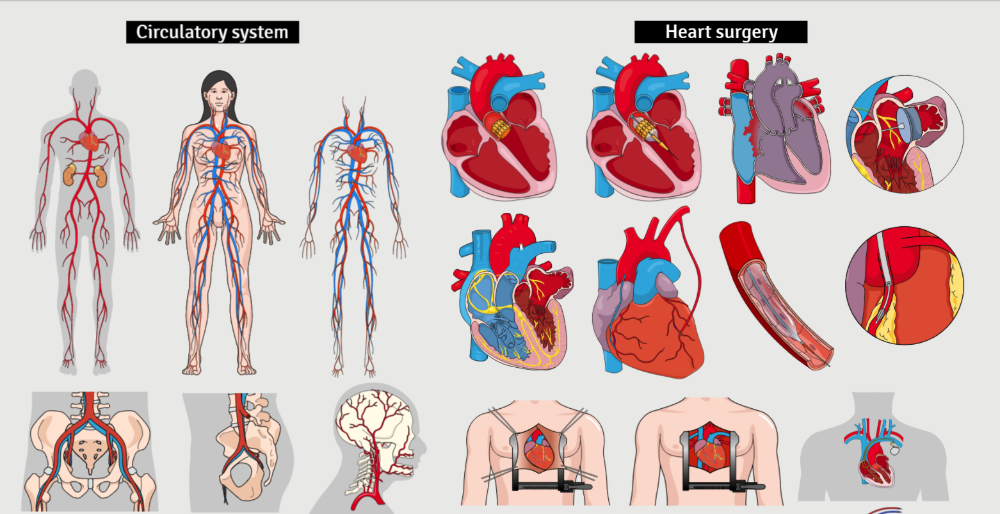
Det är inte lätt att vara läkare. Förutom att ständigt hålla sig uppdaterad om nya procedurer och tekniker, [...]
Bilder på sjukdomar i cirkulationssystemet som hjärtskador är mycket användbara för patienter och föräldrar [...].
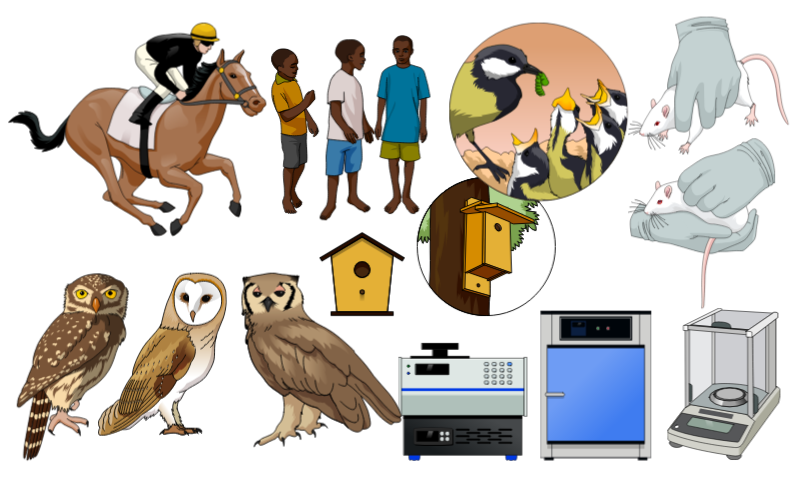
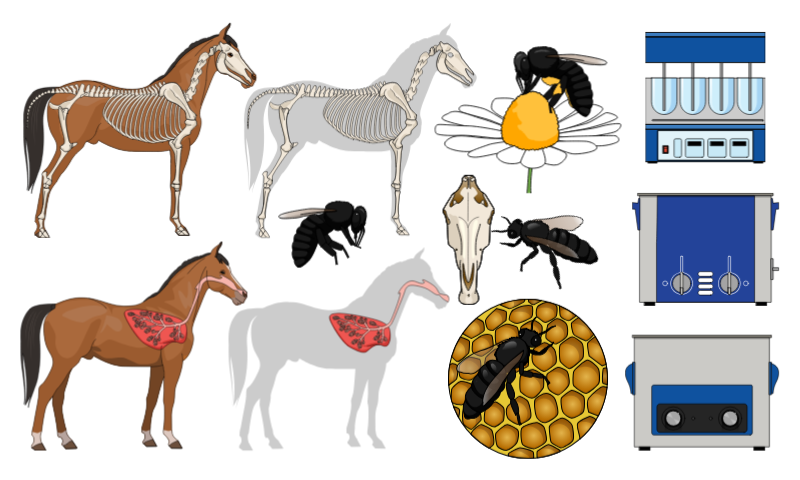
Det är vanligt att använda två eller tre olika arter i ett experiment. Förutom det, [...]
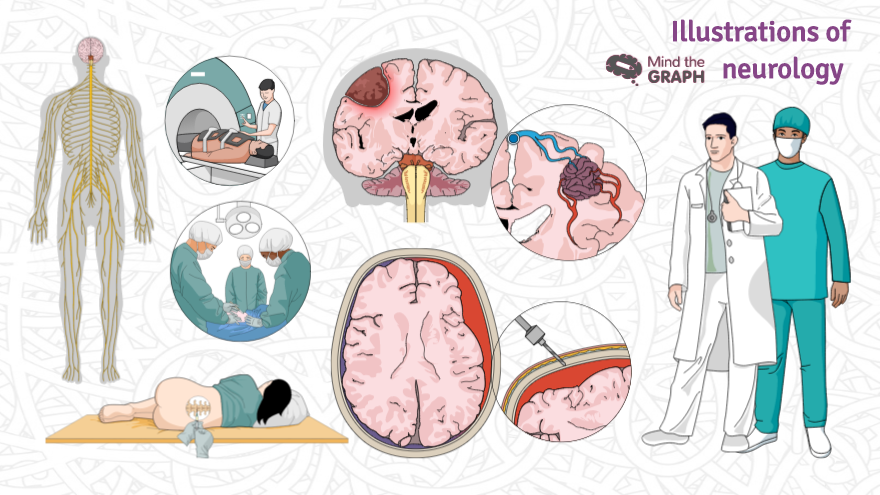
Os distúrbios neurológicos são doenças do cérebro, da coluna e dos nervos que os conectam. [...]
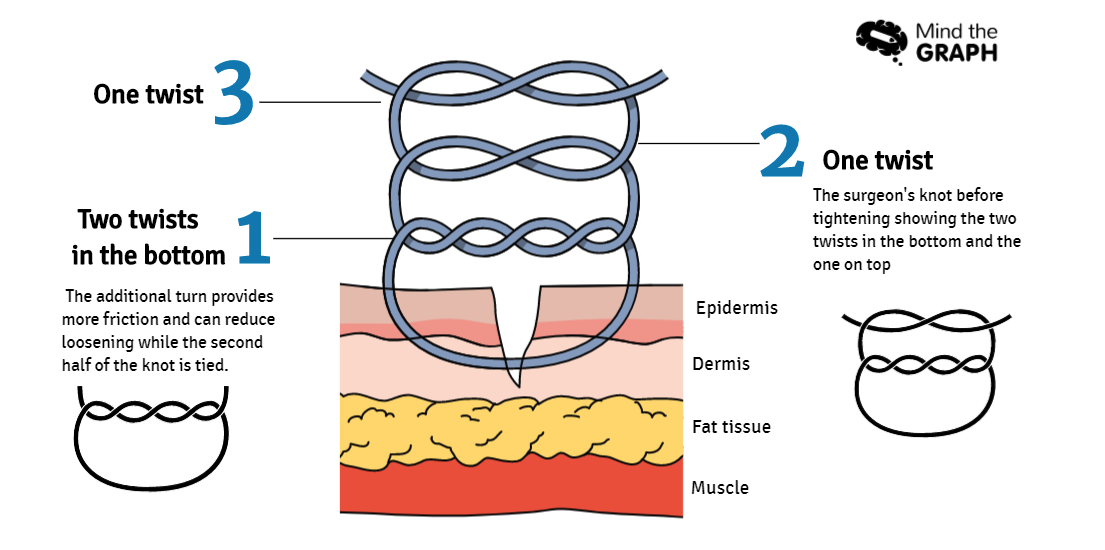
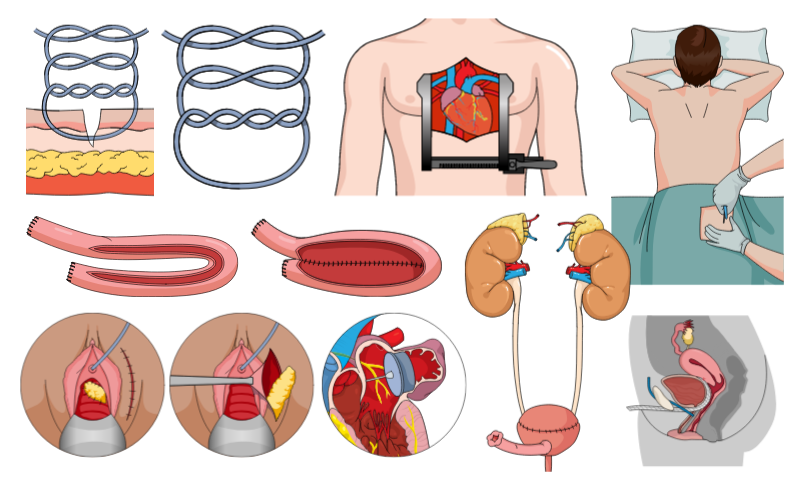
Hur presenterar du kirurgiska ingrepp på dina kurser och presentationer? Det är inte alltid lätt [...].
Det är fredag igen (YAY), så det är dags att se de nya vetenskapliga illustrationerna av [...]
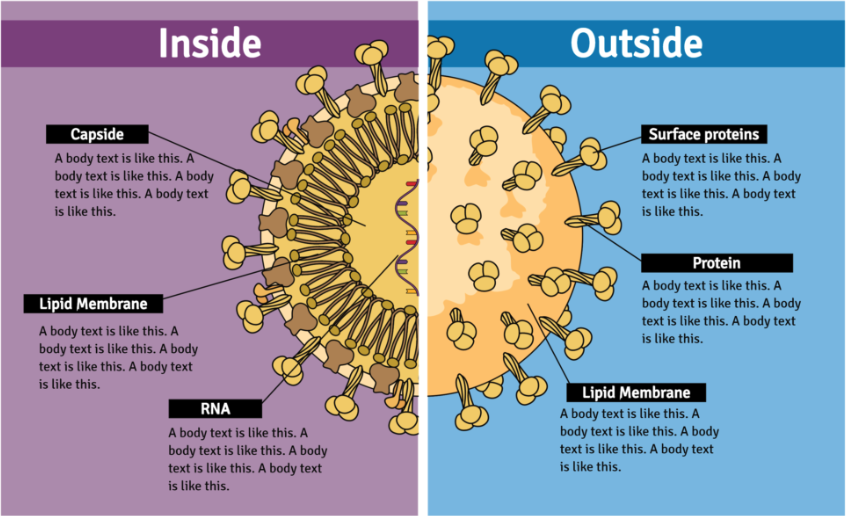
Som läkare vet du förmodligen hur viktigt det är att kommunicera väl med sina patienter. De [...]
En visuell abstraktion är inte lätt att skapa, men den är här för att stanna. Därför har vi alltid [...]
Hej, det är fredag igen (YAY) och det är dags att se de nya vetenskapliga illustrationerna av [...]
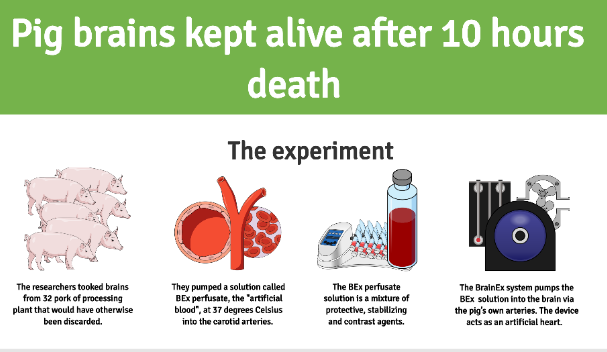
Forskare från Yale University höll grishjärnor vid liv utanför kroppen i timmar efter döden. De [...]
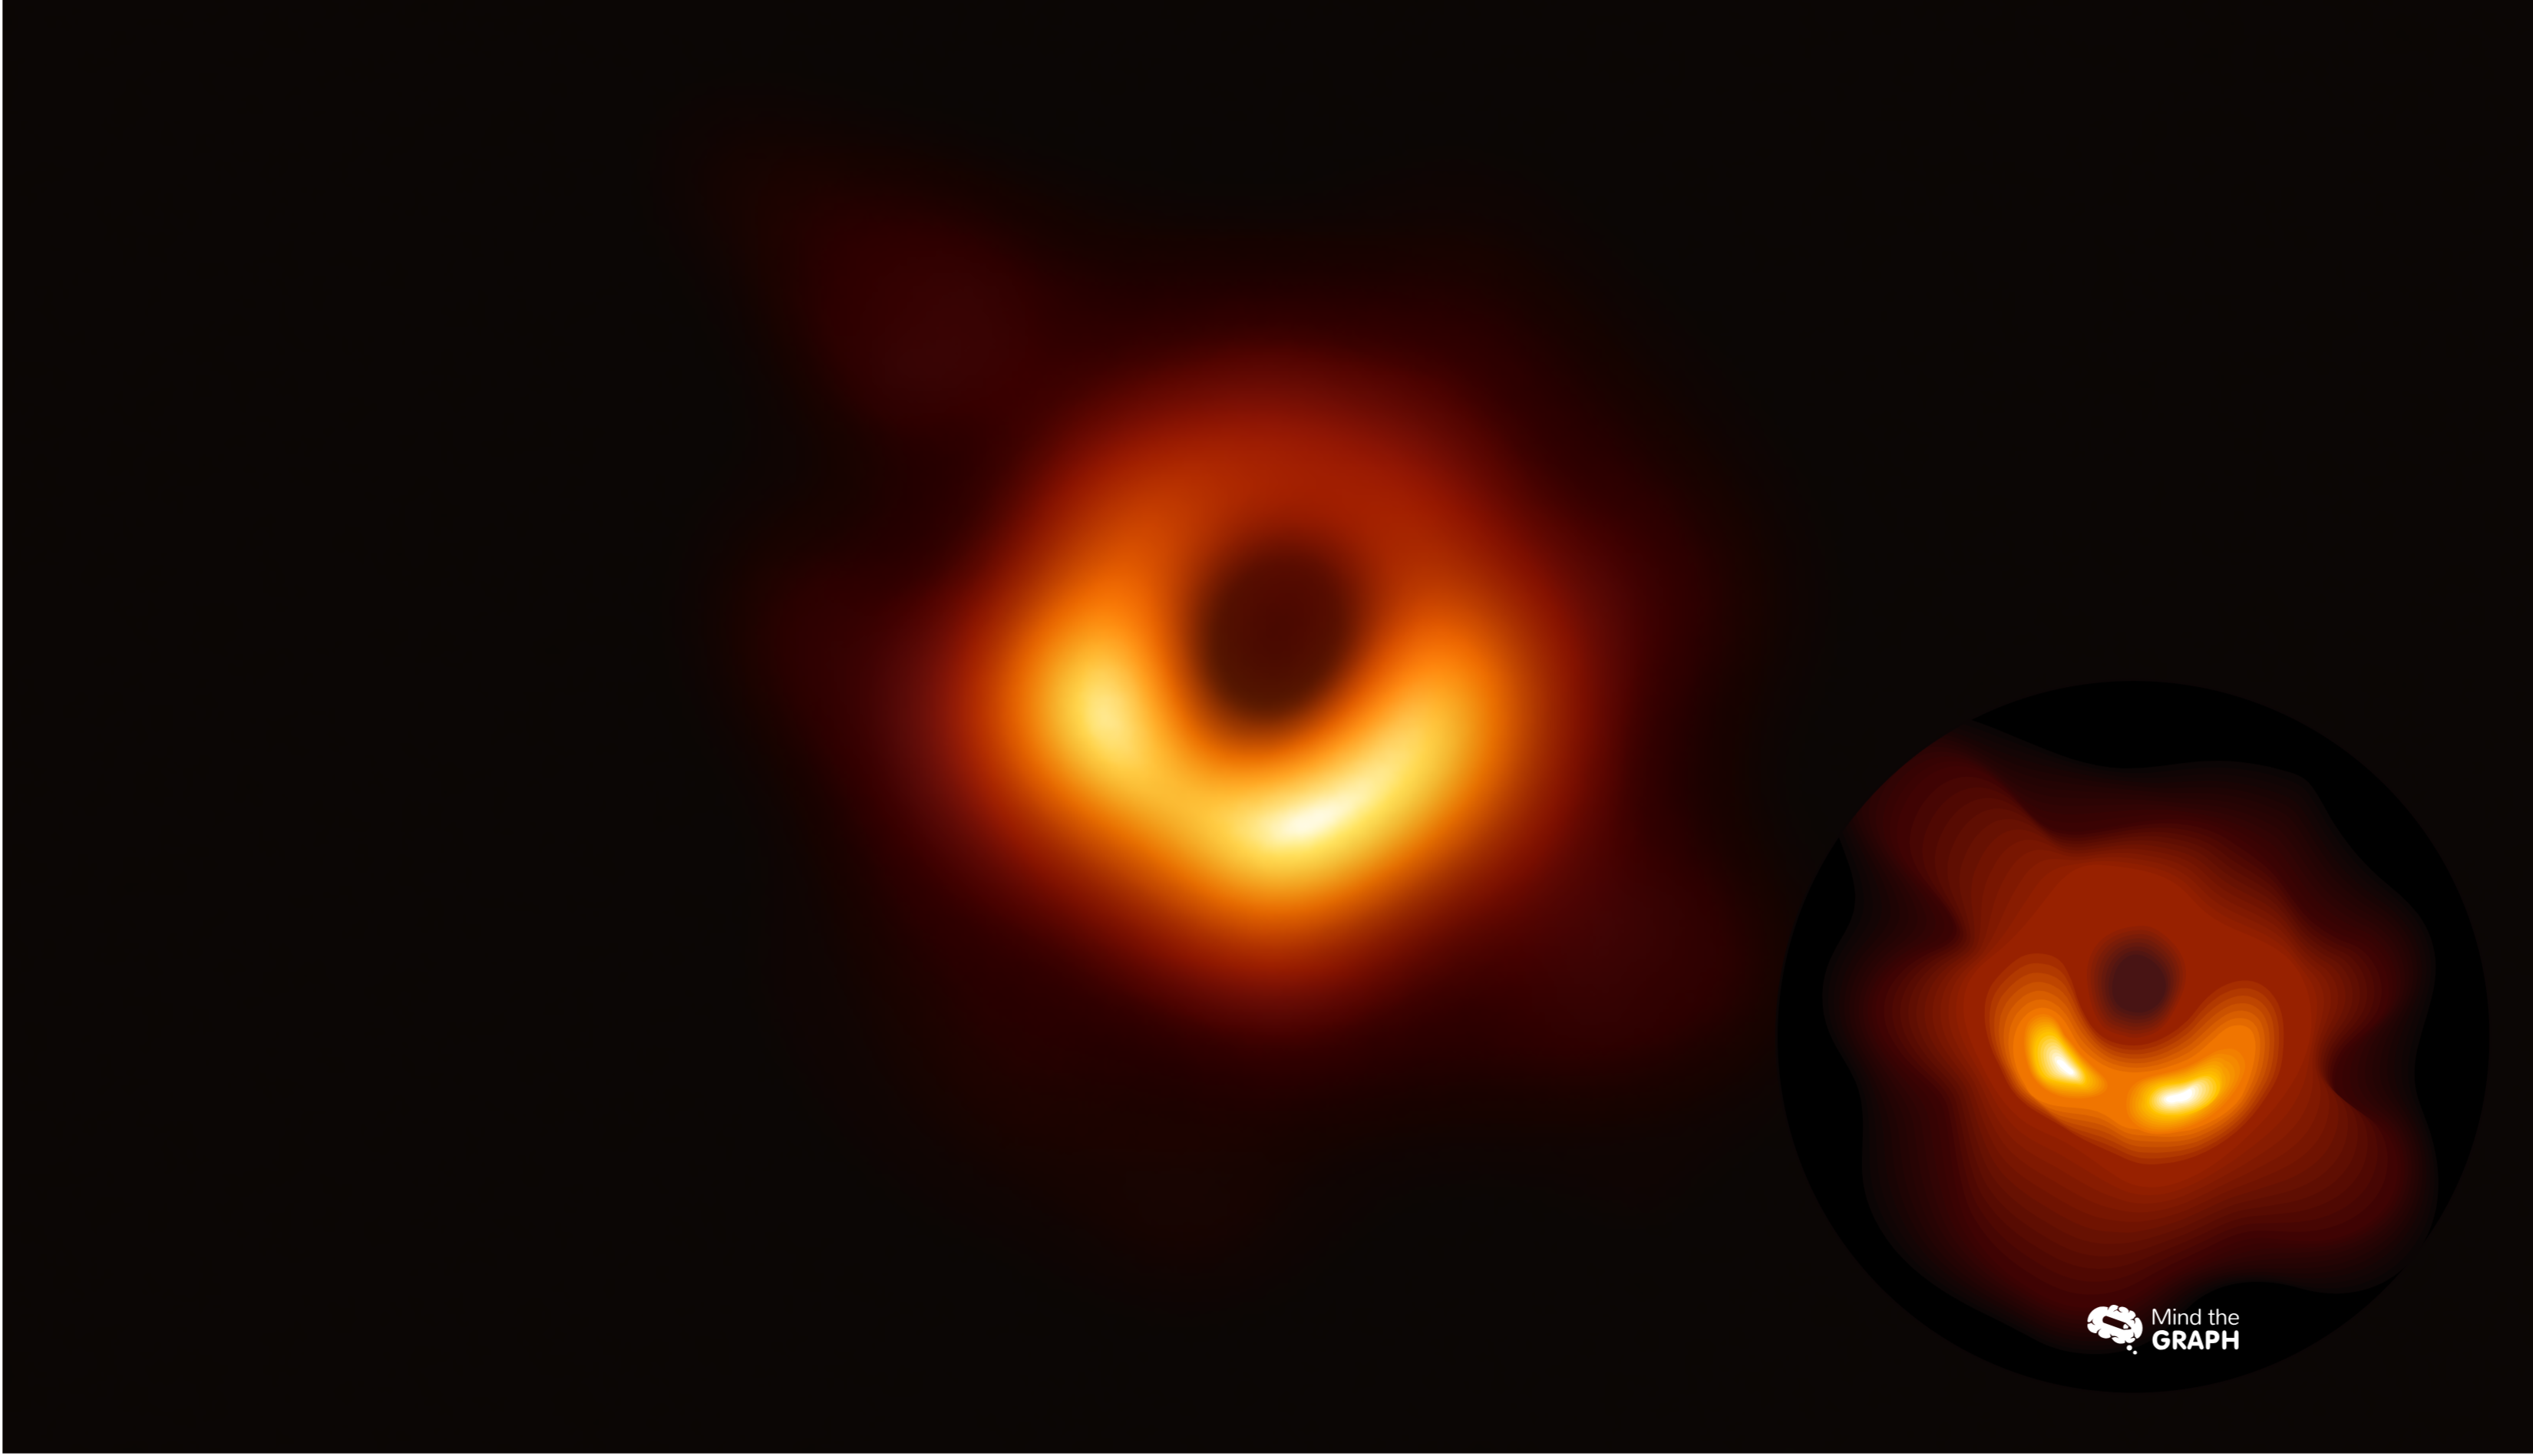
De senaste dagarna har varit spännande för alla forskare och vetenskapsentusiaster. Vi såg för [...]