2 min läsning
06/12/2020
Den vetenskapliga bloggen Mind The Graph är tänkt att hjälpa forskare att lära sig hur man kommunicerar vetenskap på ett okomplicerat sätt.
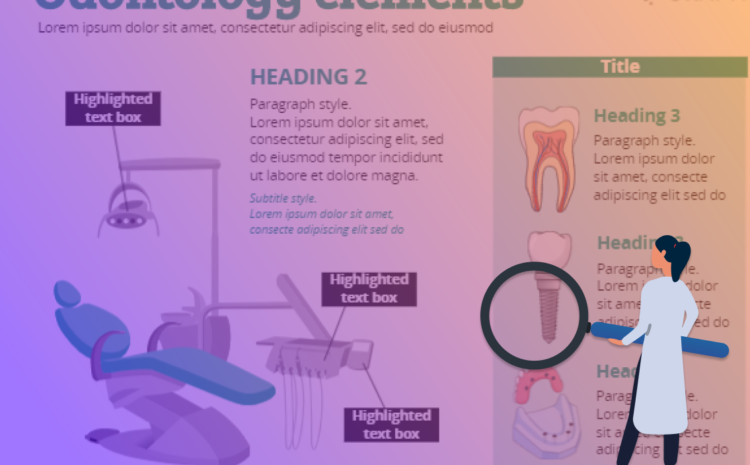
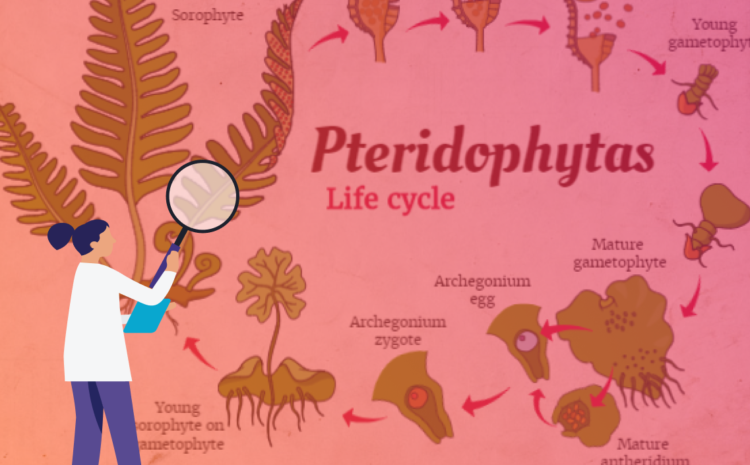
Den här instruktionsvideon visar hur du skapar en vetenskaplig poster i Mind the Graph, precis som prisbelönta vetenskapliga posters. Du behöver inte börja från scratch. Det blir alltså lättare att skapa något flashigt och intressant för att kommunicera din forskning, på kortare tid. Vi gör forskare till designers för att öka deras genomslagskraft! Lär dig i [...]
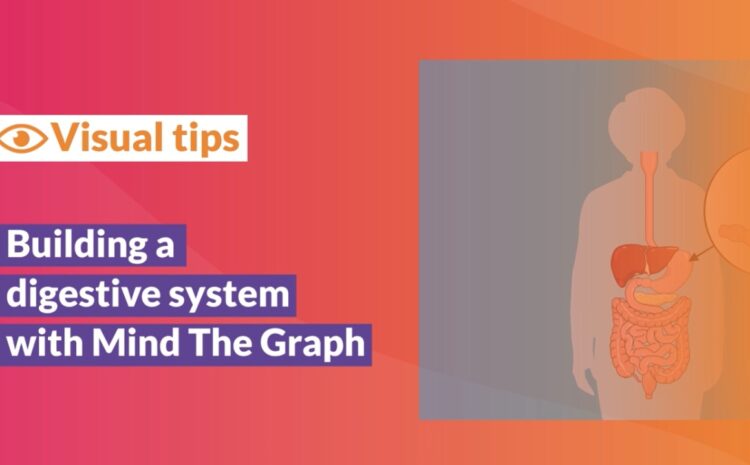
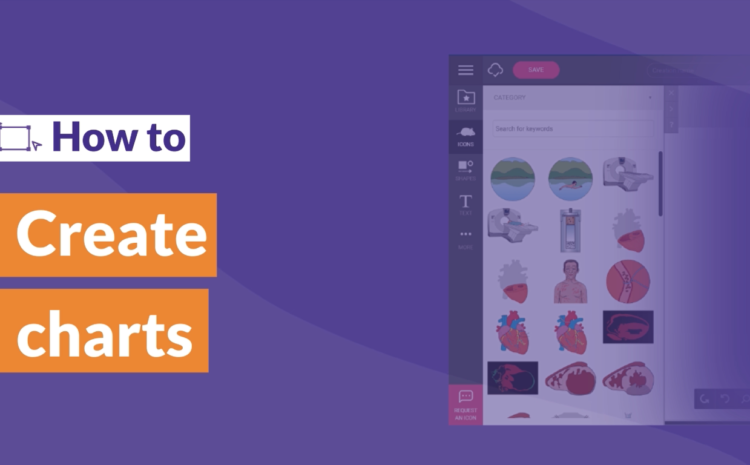
Denna handledningsvideo visar hur du kan skapa vetenskapliga diagram i mind the graph. Du [...]