Scientific reports offer a detailed narrative of research endeavors, guiding readers through the methodology employed, the data collected, the analysis conducted, and the conclusions drawn. These reports are not just about documenting findings but also about communicating them effectively to fellow researchers, policymakers, and the public. By adhering to established formats and standards, scientists ensure that their work is accessible, transparent, and reproducible. In this article, we’ll explore the details of scientific reporting, from structuring the report to interpreting its significance and highlighting its role in improving scientific knowledge and fostering innovation.
Understanding Scientific Report
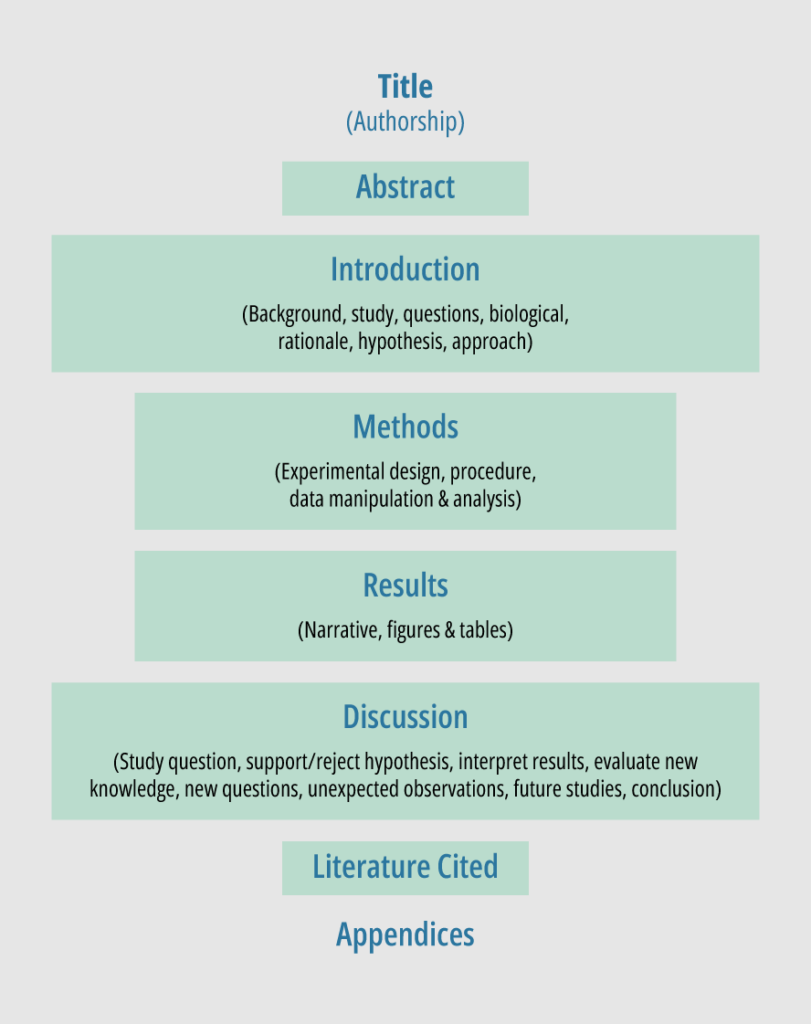
A scientific report is a formal document that systematically presents the methods, results, and conclusions of a research study or experiment. It serves as a means of communicating scientific findings to a wider audience, including fellow researchers, academics, and professionals in the field. Structured in a specific format, typically including sections such as an abstract, introduction, methods, results, discussion, conclusion, and references, a scientific report aims to provide a clear and comprehensive account of the research process and outcomes. It embodies principles of objectivity, clarity, and adherence to established conventions of scientific writing, facilitating transparency, reproducibility, and the advancement of knowledge within a particular discipline or area of study.
How To Write A Scientific Report
Crafting a precise and impactful scientific report is essential for effectively communicating research findings with clarity and accuracy. Such reports document the process, progress, and outcomes of technical or scientific research, offering insights into methodology, findings, and often, recommendations and conclusions. Serving as a vital communication tool within the scientific community and beyond, these reports facilitate knowledge dissemination across various fields.
To craft a scientific report, several key steps must be followed. Start by defining the research question and providing background information. Outline the research methodology, including materials, procedures, and data collection techniques. Present results using tables, figures, and graphs when necessary, and interpret findings in the discussion section, comparing them to existing literature and addressing limitations or implications. Conclude by summarizing key findings, their significance, and citing sources appropriately.
Writing Clear And Concise Prose
Clear and concise writing ensures that the message is easily understood without unnecessary complexity or ambiguity. When crafting prose for a scientific report, researchers should prioritize simplicity and clarity, avoiding overly technical language or convoluted sentences that may confuse or alienate readers. Simple language and concise statements are crucial for effectively communicating complex ideas within a scientific report.
Organizational Tips
Organizing information begins with creating a structured outline that includes all the necessary sections of a scientific report, such as the introduction, methods, results, discussion, and conclusion. Each section should be labeled and arranged logically to guide the reader through the research process.
Within each section, information should be presented coherently, with subheadings used to break down complex topics. Visual aids like tables, figures, and graphs can be used to illustrate data and make it easier to understand. It’s also important to maintain consistency in formatting and citation style throughout the report to ensure professionalism and adherence to academic standards.
Here are some organizational tips for crafting a scientific report:
Outline the Structure: Before starting writing, outline the structure of your report. Identify key sections such as introduction, methods, results, discussion, and conclusion.
Start with a Strong Introduction: Begin the report with a clear and concise introduction that outlines the research question, objectives, and the significance of the study.
Provide Detailed Methods: Describe the research methodology in detail, including the materials used, procedures followed, and data collection techniques employed.
Present Results Clearly: Organize your results logically and present them clearly and straightforwardly using tables, figures, and graphs where appropriate.
Discuss Findings: Interpret the results in the discussion section, comparing them to existing literature, addressing any limitations, and exploring the broader implications of your findings.
Conclude Succinctly: Summarize the main findings of your study in the conclusion, reiterating their significance and potential impact.
Use Subheadings and Transitions: Use subheadings to break up large sections of text and guide the reader through the report. Ensure smooth transitions between paragraphs and sections to maintain coherence.
Proofread and Edit: Before submitting your report, carefully proofread and edit for clarity, coherence, and accuracy. Check for any grammatical errors, inconsistencies, or typos.
Formatting And Citation Guidelines
In scientific reports, adherence to specific formatting styles, such as APA, MLA, or Chicago, is essential for maintaining uniformity and professionalism. These styles dictate the layout of the document, including font size, margins, spacing, and the presentation of tables, figures, and equations. Additionally, accurate and proper citation of sources is imperative to acknowledge the contributions of others and avoid plagiarism. Researchers must follow established citation formats when referencing sources within the text and compiling a list of references at the end of the report.
Related articles:
- Everything You Need To Know About APA Formatting
- Chicago Style Citation Made Easy: Formatting and Examples
- A Writer’s Guide to MLA Format: How to Get It Right
Scientific Report Elements
Title Page
The title page of a scientific report typically includes the title of the report, the authors’ names and affiliations, and often the date of submission. The title should convey the main focus of the research while accurately representing its content. The authors’ names and affiliations provide credit and context to the research, while the date indicates the timeline of the report’s completion.
Table of Contents
The table of contents provides a roadmap for the reader, outlining the report’s structure and indicating where each section begins. It lists the major sections and subsections along with their corresponding page numbers, enabling readers to navigate the document efficiently and locate specific information of interest.
Abstract
The abstract is a concise summary of the entire scientific report, typically ranging from 150 to 250 words. It briefly describes the research objectives, methods, results, and conclusions, providing readers with a quick overview of the study’s key findings and significance. The abstract serves as a crucial entry point for readers to determine whether the report aligns with their interests and information needs.
Introduction
The introduction sets the stage for the research by providing background information, contextualizing the study within existing literature, and stating the research objectives or hypotheses. It outlines the rationale for the research, identifies gaps or unresolved questions in the literature, and establishes the significance of the study. The introduction aims to capture the reader’s interest and provide a clear understanding of the research context and purpose.
Materials and Methods (Experimental)
The materials and methods section provides a detailed description of the experimental procedures and methodologies employed in the research. It includes information on the materials, equipment, and instruments used and the specific steps taken to conduct the experiments or observations. This section should be written in a clear and precise way, enabling other researchers to replicate the study if desired.
Results
The results section presents the findings of the research clearly and systematically. It typically includes tables, figures, graphs, or other visual aids to illustrate the data collected during the study. The results are often organized according to the research objectives or hypotheses and are accompanied by descriptive text that highlights key findings and trends observed in the data.
Discussion
The discussion section interprets and analyzes the results presented in the previous section, placing them in the context of existing literature and theoretical frameworks. It explores the implications of the findings, discusses possible explanations for observed patterns or discrepancies, and addresses the significance and limitations of the research. The discussion aims to provide a deeper understanding of the research outcomes and stimulate further inquiry in the field.
Conclusion
The conclusion summarizes the main findings of the research and their implications, reiterating the significance of the study in light of the research objectives or hypotheses. It may also offer suggestions for future research directions or practical applications based on the findings. The conclusion provides closure to the report and reinforces the key takeaways for the reader.
References
The references section lists all sources cited within the scientific report, following a specific citation style such as APA, MLA, or Chicago. It provides readers with the necessary information to locate and verify the sources used in the research, thereby ensuring transparency and credibility. The references are typically arranged alphabetically by the authors’ last names and include full bibliographic details such as author names, publication titles, journal names, publication dates, and page numbers.
Find more tips here: Formatting Science Reports.
Ethical Considerations
Within the framework of a scientific report, ethical considerations encompass a range of principles and practices aimed at ensuring the ethical conduct of research. These include upholding honesty and accuracy in reporting findings, avoiding plagiarism and data fabrication, disclosing conflicts of interest, obtaining informed consent from participants, respecting the welfare and rights of human subjects and animals, managing data responsibly, and adhering to publication ethics. By prioritizing ethical considerations, researchers uphold the trustworthiness and credibility of their work, safeguard the welfare of research participants, and contribute to the advancement of knowledge ethically and responsibly.
Integrity And Transparency
Ethical scientific reporting hinges on the principles of integrity and transparency. Researchers must conduct their studies with unwavering honesty, ensuring that their methodologies, data collection processes, and interpretations are transparently presented. Transparency extends to disclosing any potential biases, limitations, or conflicts of interest that could influence the research outcomes. By upholding integrity and transparency, scientists foster trust within the scientific community and promote the reliability of their findings.
Scientific Reporting Pitfalls
Plagiarism, data fabrication, and conflicts of interest are ethical pitfalls that researchers must vigilantly avoid in scientific reporting. Plagiarism involves using someone else’s work, ideas, or words without proper acknowledgment, which undermines the originality and integrity of the research. Data fabrication refers to the deliberate manipulation or falsification of research data to support desired conclusions, compromising the accuracy and validity of the findings.
Conflicts of interest arise when researchers have personal, financial, or professional interests that could unduly influence their research objectivity or reporting. Researchers must adhere to ethical guidelines and standards, actively preventing and addressing instances of plagiarism, data fabrication, and conflicts of interest. By upholding ethical principles, scientific reports maintain their credibility and contribute to the advancement of knowledge with integrity.
Navigating Data Analysis
Navigating data analysis in a scientific report involves the process of interpreting and making sense of the data collected during research. It encompasses various steps, including data cleaning, data exploration, statistical analysis, and drawing conclusions based on the findings. Researchers must choose appropriate statistical methods to analyze their data and ensure the accuracy and reliability of their results.
Navigating data analysis also involves effectively communicating the findings through clear and concise presentation in the scientific report, often using tables, figures, and graphs to illustrate key patterns and trends. Ultimately, the goal of navigating data analysis is to derive meaningful insights from the data collected, contributing to the overall objectives of the research study.
Data Cleaning
Data cleaning is a crucial process in research methodology that involves identifying and rectifying errors, inconsistencies, and missing values within a dataset. By meticulously addressing duplicate entries, correcting errors and outliers, filling in missing data points, and standardizing formats and units, researchers ensure the accuracy and integrity of the dataset. This meticulous attention to detail minimizes the risk of bias and inaccuracies in subsequent analysis, resulting in more reliable and robust research findings.
Data Exploration
Data exploration, a foundational step in the data analysis process, entails the systematic examination of a dataset to uncover patterns, trends, and relationships. Through visual and statistical techniques such as scatter plots, histograms, and correlation matrices, researchers gain valuable insights into the structure and characteristics of the data. By identifying outliers, anomalies, and potential data quality issues, researchers can refine their research questions, formulate hypotheses, and guide subsequent analysis. Data exploration facilitates a deeper understanding of the dataset, enabling researchers to make informed decisions and derive meaningful insights that contribute to the research objectives.
Common Statistical Analysis
Scientific reports often rely on various statistical methods to analyze data and draw meaningful conclusions. These methods may include descriptive statistics to summarize data, inferential statistics to make inferences about populations based on sample data, and hypothesis testing to assess the significance of research findings. Understanding and selecting appropriate statistical techniques based on the research design and data characteristics are crucial for conducting rigorous data analysis.
Data Interpretation And Presentation
Once data analysis is complete, the next step is to interpret the results and present them clearly and informally within the scientific report. This involves examining patterns, trends, and relationships in the data to draw meaningful conclusions that address the research objectives or hypotheses. Data interpretation should be guided by statistical findings and supported by evidence from the research. Additionally, presenting the results effectively using tables, figures, graphs, and charts enhances the clarity and accessibility of the findings for readers. By effectively navigating data analysis, researchers can elucidate the significance of their findings and contribute valuable insights to their field of study within the scientific report.
Communicating Findings
In a scientific report, communicating findings is the section where the researcher presents the results and conclusions drawn from the study. This section typically follows the methods and results sections and interprets the data collected and analyzed. Below are the typical components of a communicating findings section:
Presentation of Results: This involves presenting the key findings of the study, often in the form of tables, graphs, charts, or other visual aids. Data should be organized and clearly labeled to facilitate understanding.
Interpretation of Results: After presenting the data, the researcher explains the significance of the findings. This may involve discussing patterns, trends, relationships, or differences observed in the data. The interpretation should be objective and supported by evidence from the results.
Discussion of Implications: The researcher discusses the broader implications of the findings within the context of the research question or hypothesis. This may involve relating the results to existing theories, discussing practical applications, or considering implications for future research.
Comparison with Previous Studies: If relevant, the researcher may compare their findings with those of previous studies. This can help contextualize the results and identify areas of agreement or divergence with existing literature.
Limitations: It’s important to acknowledge any limitations or constraints of the study that may have influenced the findings. This could include issues such as sample size, methodology, or measurement error.
Conclusion: The section typically concludes with a summary of the main findings and their significance. This may also include suggestions for future research directions based on the current findings.
Strategies For Diverse Audiences
Effectively communicating findings in a Scientific Report is essential for ensuring the research’s understanding and impact across diverse audiences. Strategies for diverse audiences include tailoring communication to fellow researchers by balancing technical detail with clarity and context, presenting findings to policymakers in a relevant and actionable manner to inform policy decisions, and translating complex scientific information for the general public using relatable language, analogies, and visual aids. By employing these strategies, researchers can maximize the accessibility and relevance of their findings, fostering broader understanding and engagement with their work.
Importance Of Clarity And Accessibility
The importance of clarity and accessibility in scientific reporting is twofold: clear and straightforward presentation of findings ensures accurate interpretation by readers, achieved through logical structuring, concise language, and avoidance of ambiguity; additionally, accessibility is enhanced by employing visuals, formatting techniques, and plain language summaries, facilitating comprehension for a diverse audience. These elements collectively break down complex information, making the report more digestible and readable for all readers.
Peer Review Process
Understanding the peer review process and effectively responding to reviewer feedback are integral components of ensuring the quality and credibility of research findings.
Overview of Peer Review
The peer review process is a cornerstone of scientific publishing, where manuscripts undergo evaluation by independent experts in the field before publication. This rigorous evaluation ensures that the research meets high standards of quality, accuracy, and validity. Peer review typically involves several stages, including submission, assessment by reviewers, and revisions based on feedback. Reviewers evaluate the originality, significance, methodology, and clarity of the research, providing constructive feedback to authors to improve the manuscript.
Also read: Peer Review Process: Understanding The Pathway To Publication
Responding To Reviewer Feedback
Upon receiving feedback from reviewers, authors are tasked with addressing their comments and suggestions thoughtfully and thoroughly. This may involve revising the manuscript, clarifying methods or results, providing additional evidence or analysis, or addressing any concerns raised by reviewers. Authors should approach reviewer feedback with an open mind, considering each comment carefully and providing clear and detailed responses to demonstrate how they have addressed the reviewers’ concerns. Effective communication and collaboration between authors and reviewers are essential for ensuring that the final manuscript meets the standards of rigor and excellence expected in scientific publishing.
Science Figures, Graphical Abstracts, And Infographics For Your Research
Mind the Graph is a comprehensive platform that offers a range of tools and resources to assist scientists in effectively communicating their research findings. One of the key features of Mind the Graph is its provision of science figures, which allows researchers to create visually appealing and informative graphical representations of their data. These figures are essential for presenting complex scientific concepts and experimental results clearly and concisely. Mind the Graph offers graphical abstracts, enabling researchers to summarize their research findings in a visually engaging format that quickly captures the attention of readers. The platform provides access to a wide variety of customizable infographics, allowing scientists to visually communicate key information and concepts related to their research projects. Subscribe now and start using the tool for free for 7 days.

Subscribe to our newsletter
Exclusive high quality content about effective visual
communication in science.

