Regression analysis is an approach for identifying and analyzing the connection between one or more independent variables and a dependent variable. This method is extensively used in a variety of disciplines, including healthcare, social sciences, engineering, economics, and business. You can use regression analysis to investigate the fundamental relationships in data and develop predictive models that will assist you in making informed decisions.
This article will provide you with a comprehensive overview of regression analysis, including how it works, an easy-to-grasp example, and it will explain how it differs from correlation analysis.
What Is Regression Analysis?
Regression analysis is a statistical method for identifying and quantifying the connection between a dependent variable and one or more independent variables. In a nutshell, it helps you comprehend how changes in one or more independent variables are related to changes in the dependent variable.
To obtain a thorough understanding of regression analysis, you must first comprehend the following terms:
- Dependent Variable: This is the variable that you’re interested in analyzing or predicting. It’s the outcome variable that you’re trying to understand and explain.
- Independent Variables: These are the variables that you believe have an effect on the dependent variable. They’re often referred to as the predictor variables, as they’re used to predict or explain changes in the dependent variable.
Regression analysis can be used for a range of circumstances, including predicting future values of the dependent variable, understanding the effect of independent variables on the dependent variable, and finding outliers or unusual occurrences in data collection.
Regression analysis can be classified into several types, including single linear regression, logistic regression, polynomial regression, and multiple regression. The suitable regression model is determined by the nature of the data and the investigation’s subject under consideration.
How Does Regression Analysis Work?
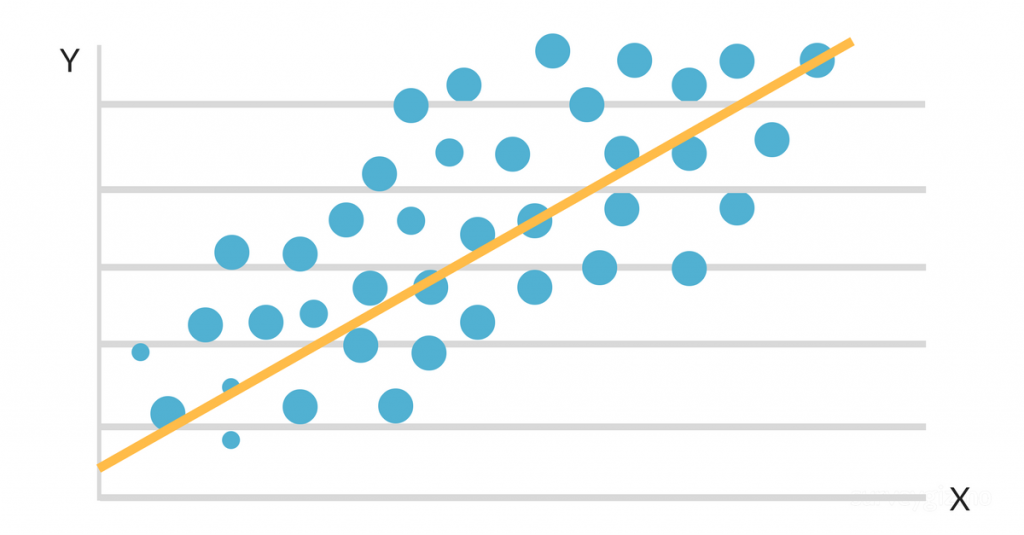
The purpose of regression analysis is to identify the best-fit line or curve that reflects the connection between the independent variables and the dependent variable. This best-fit line or curve is generated using statistical methods that reduce the disparities between the expected and real values in the data collection.
Here are the formulas for the two most common types of regression analysis:
Single Linear Regression
In Simple Linear Regression, you use a line of best fit to show the relationship between two variables: the independent variable (x) and the dependent variable (y).
The line of best fit can be represented by the equation: y = a + bx.
Here, a is the intercept, b is the slope of the line. To calculate the slope, you use the formula: b = (nΣ(xy) – ΣxΣy) / (nΣ(x2) – (Σx)2), where n is the number of observations, Σxy is the sum of the product of x and y, Σx and Σy are the sums of x and y respectively, and Σ(x2) is the sum of the squares of x.
To calculate the intercept, you use the formula: a = (Σy – bΣx) / n.
Multiple Regression
Multiple Linear Regression:
The formula for the equation of the multiple linear regression model is:
y = b0 + b1x1 + b2x2 + … + bnxn
where y is the dependent variable, x1, x2, …, xn are the independent variables, and b0, b1, b2, …, bn are the coefficients of the independent variables.
The formula for estimating the coefficients using ordinary least squares is:
β = (X’X)(-1)X’y
where β is a column vector of coefficients, X is the design matrix of independent variables, X’ is the transpose of X, and y is the vector of observations of the dependent variable.
Regression Analysis Example
Assume you want to look into the connection between an individual’s grade point average (GPA) and the number of hours they study per week. You gather information from a set of students, including their number of study hours and grade point average.
Then, use the regression analysis to see if there is a linear connection between both variables and if so, you can build a model that predicts a student’s GPA based on the number of hours they study per week.

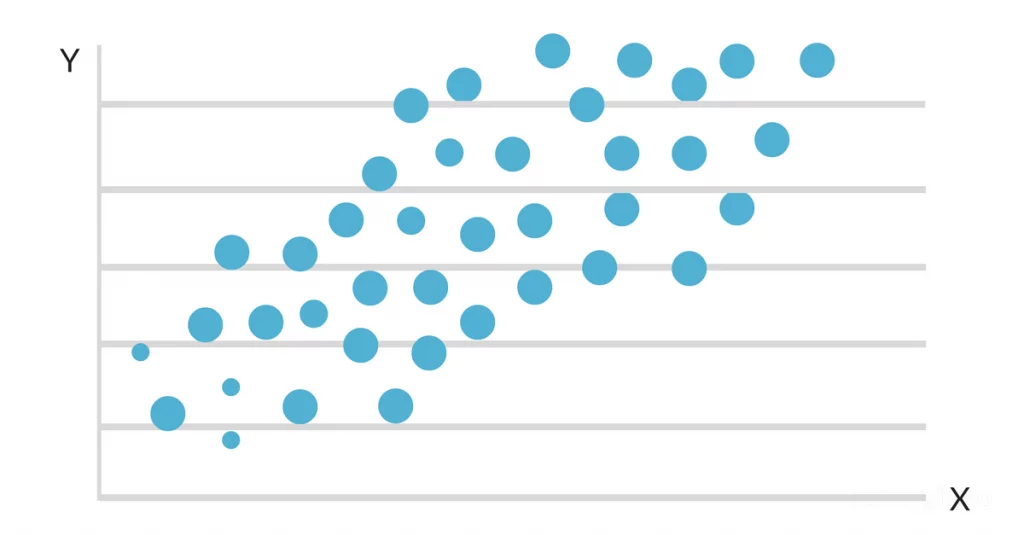
When the data is plotted on a scatter map, it appears that there is a favorable linear connection between study hours and GPA. The slope and intercept of the line of best fit are then estimated using a simple linear regression model. The final solution could look like this:
GPA = 2.0 + 0.3 (hours studied per week)
This equation states that for every extra hour of study per week, a student’s GPA will rise by 0.3 point, with everything else being equivalent. This algorithm can be used to forecast a student’s GPA based on how many hours they study per week, as well as to identify which students are at risk of underperforming based on their study routines.
Using the data from the example, the values for b and a are as follows:
n = 10 (the number of observations)
Σx = 30 (the sum of the study hours)
Σy = 25 (the sum of the GPAs)
Σxy = 149 (the sum of the product of study hours and GPAs)
Σ(x)2 = 102 (the sum of the squares of study hours)
Using these values, calculate b as:
b = (nΣ(xy) – ΣxΣy) / (nΣ(x2) – (Σx)2)
= (10 * 149 – 30 * 25) / (10 * 102 – 302)
= 0.3
And calculate a as:
a = (Σy – bΣx) / n
= (25 – 0.3 * 30) / 10
= 2.0
Therefore, the equation of the line of best fit is:
GPA = 2.0 + 0.3 (hours studied per week)
What is the difference between correlation and regression?
Both correlation and regression are statistical methods for examining the connection between two variables. They serve different purposes and provide differing types of information.
Correlation is a measure of the strength and course of a connection between two variables. It runs from -1 to +1, with -1 representing a perfect negative correlation, 0 representing no correlation, and +1 representing a perfect positive correlation. Correlation indicates the degree to which two variables are connected, but it does not indicate cause or predictability.
Regression, on the other hand, is a method for modeling the connection between two variables, typically in order to forecast or explain one variable based on the other. Regression analysis can provide estimations of the size and direction of the relationship, as well as statistical significance tests, confidence ranges, and future result forecasts.
Your Creations, ready within minutes
Mind the Graph is an online platform that offers you an extensive library of scientific illustrations and infographic designs that can be simply modified to meet your unique needs. Make professional-looking charts, posters, and graphical abstracts in minutes by using a drag-and-drop interface and a wide range of tools and features.


Subscribe to our newsletter
Exclusive high quality content about effective visual
communication in science.