
Welcome to the Mind the Graph Experience!
This is the first article of a series that will share artworks (aka science figures) made by our users in the Mind the Graph platform.
Selv om det i dag finnes mange verktøy som kan hjelpe oss med å lage profesjonelle figurer, er det likevel vanskelig å få ideene ned på papiret, spesielt når det gjelder vitenskapelige figurer.
For å hjelpe deg med å bryte ned noen vegger i hodet ditt har vi derfor valgt å dele noen referanser til vitenskapelige figurer med deg.
Ja, referanser!
For å lage en vitenskapelig figur (akkurat som alt annet i livet) trenger vi referanser. Vi må se eksempler på figurer for å kunne visualisere hvilket konsept vi ønsker å formidle og hvordan vi skal formidle det.
Derfor bestemte vi oss for å lage denne samlingen for å inspirere deg.
I denne nye kategorien av blogginnlegg vil vi fra Mind the Graph vise deg hvordan brukerne av Mind the Graph bruker plattformen til å lage sine vitenskapelige figurer, og hvordan plattformen har forandret livet deres.
You will see here science figures (infographics and graphical abstracts) from published papers and different research fields to inspire you to create your professional science figure, for your research. And more, a brief explanation about how they communicate their research with science figures
Vi sier hele tiden at du allerede har alt du trenger for å få et gjennombrudd, plattformen gir deg bare verktøyene.
Mind the Graphs arbeidsområde er designet for å være intuitivt, enkelt å bruke og flytende, slik at det til slutt optimaliserer (bruker)tiden din.
Vi vil at du skal kunne skape alt og hva som helst som faller deg inn.
MTG har det største illustrasjonsbiblioteket som finnes, og du kan bruke så mange illustrasjoner du vil. Utover det vil den vakre illustrasjonsdesignen garantert få arbeidet ditt til å skille seg ut.
La oss komme rett til saken!

Utgitt av Journal of Pharmacy and Pharmacology, Figueira og kolleger har designet og lagt til vitenskapsfiguren nedenfor i artikkelen sin. Ta en titt på den!
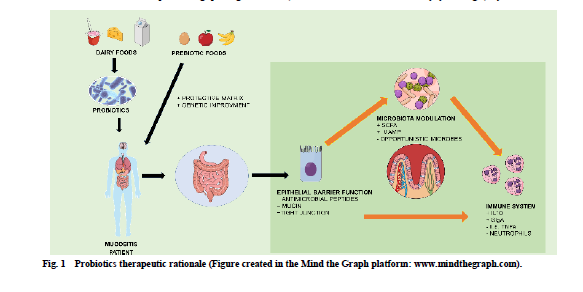
The article discusses the use of selected strains of probiotics to treat mucositis, an inflammatory condition caused by radiotherapy and chemotherapy drugs. Today, a considerable number of patients develop the condition due to their cancer treatments, and there is not yet a successful way to treat or prevent it. The high level of apoptosis of intestinal cells caused by the radiotherapy and chemotherapy drugs, cause the loss of the epithelial barrier of the gut, turning the exposed area susceptible to parasite microbes, which in turn, can induce other health problems to the patient, like ulcer, or even the systemic circulation of the microbe. However, dairy origin probiotic strains showed themselves as a potential option of treatment and prevention of mucositis, being able to control several intestinal factors. The benefits include the help to sustain the mucus barrier and intestinal permeability of the gut, the exclusion of pathogenic bacterias, modulation of immune signaling molecules, and prevention against apoptosis and oxidative damage.
Som du kan se, er denne korte forklaringen av artikkelen til stede i vitenskapsfiguren. De fanger opp all viktig informasjon i artikkelen og viser den visuelt. Vi kan helt sikkert forstå hva artikkelen handler om bare ved å se på den.
Veldig kult, ikke sant?
I en annen artikkel publisert i IntechOpen, Aktuelle temaer innen malaria i 2016Souza og teamet hennes bestemte seg for å legge til mer enn én vitenskapelig figur i arbeidet sitt. Kombinasjonen gjorde det mulig for leserne å raskt forstå viktige poenger i forskningen.
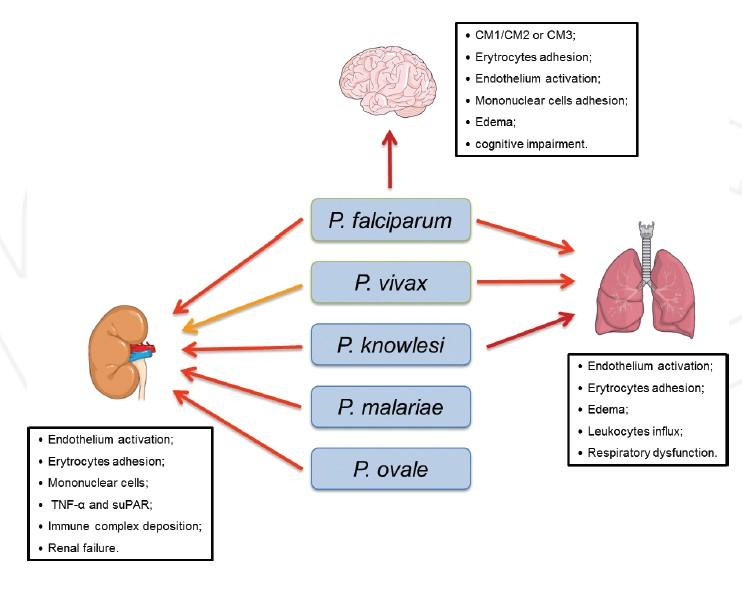
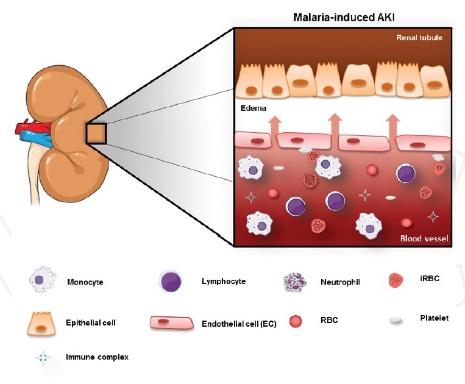
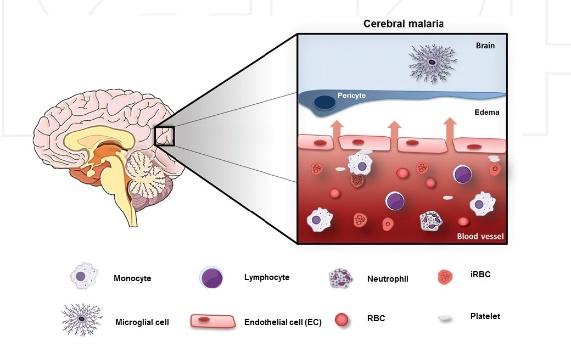
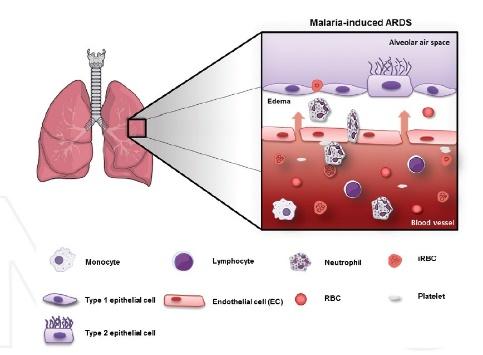
The article had the purpose to study how inflammatory responses in severe malaria affect multi-organ dysfunction, focusing on lungs, kidneys, and brain. The researchers found out that membrane-proteins expressed by the protozoa, act as a trigger to the inflammatory response and each organ has its specific response due to different anatomical and physiological characteristics, leading sometimes to organ dysfunction.
The authors designed one science figure for each organ studied, plus a graphical abstract gathering the study highlights. The science figure is self-exploratory, with keywords, plus accurate and informative illustrations from the Mind the Graphs platform – all the prerequisites to capture readers’ attention.
Og sist, men ikke minst, tilgjengelig i tidsskriftet Clinical and Experimental Pharmacology and Physiology, the authors of the article added to their text work a wonderful science figure showing a representative scheme of their hypothesis and the protocol used in the methodology.
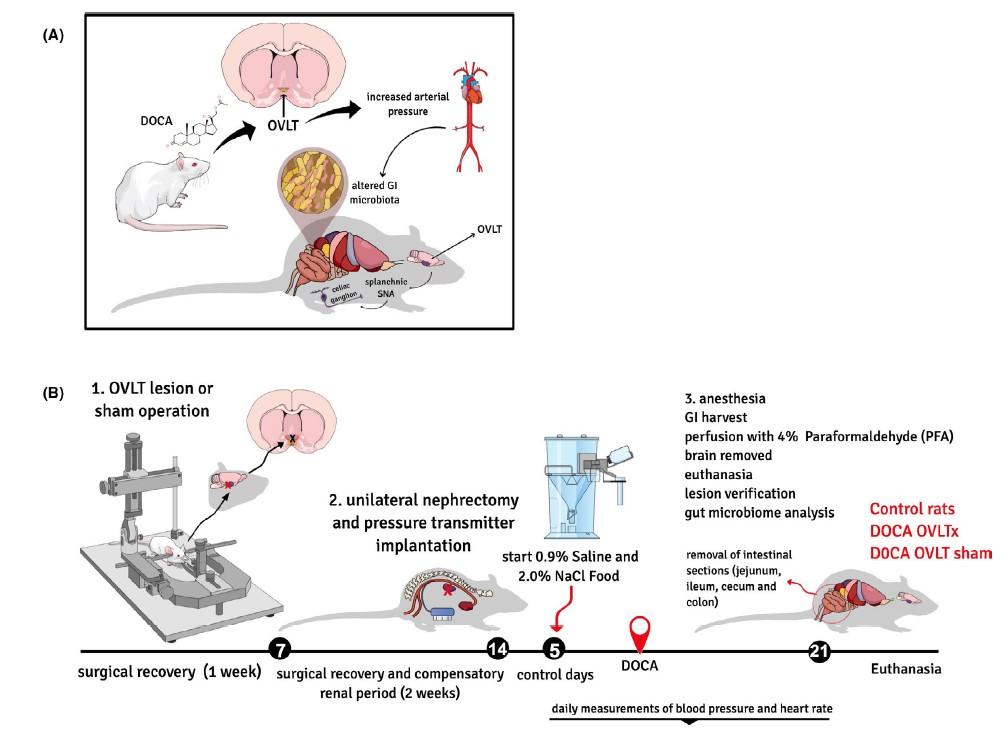
Artikkelen diskuterer og utfolder en ny teori om sammenhengen mellom sammensetningen og aktiviteten i mage-tarm-mikrobiotaen og høyt blodtrykk. Forskerne sendte voksne hannrotter inn i en eksperimentell protokoll i fem trinn: Rottene ble operert for å skade bestemte områder i hjernen, og etter noen dager gjennomgikk de en annen type operasjon. Etter å ha kommet seg, fikk de en utvalgt diett og drikkeløsninger. Etter en periode med observasjon og datainnsamling ble rottene avlivet, og visse deler av tarmsystemet ble fjernet og frosset ned for analyse.
I vitenskapsfiguren ovenfor gjorde nøyaktige illustrasjoner det mulig for oss som lesere å forstå studien, og i tillegg se viktige detaljer om forskningen.
Nayara Pestana-Oliveira, the first author of the article, shared with us, from Mind the Graph, a testimonial about her experience with the platform. Take a look at her message and how the platform helped to change the visual of her work.
“So, I use the platform to make illustrations like graphical abstract, experimental design, and hypothesis. Sometimes I needed something and I didn’t have exactly the illustration I wanted. So I asked and it was taken care of. There are a wide variety of options. But I still miss more specific things, mainly related to animal models not linked to behavior. My line of research involves female reproduction and hypertension, both in animal models. The platform meets my needs and has improved considerably. Verkene mine har blitt hyllet og fått en identitet."
Det er vi veldig glade for å høre, Nayara!
Og akkurat som Nayara gjorde, kan du også be om en spesifikk illustrasjon, og vårt team av designere vil lage designet spesielt for deg. Klikk på her for å se hvordan du ber om en illustrasjon.
We love to see testimonials like this, and how researchers from all over the world discovered new ways of explaining their work, improving their visual communication.
Vi håper at alle referansene til vitenskapelige figurer i dette innlegget har inspirert deg til å tenke nytt og gjøre ting annerledes i ditt neste prosjekt.
Mind the Graph's formål i denne verden er å løse opp vitenskapen gjennom visuelle og kreative koblinger. Utstyrt med et stort bibliotek med illustrasjoner og maler ønsker vi å inspirere forskere til å forlate det vanlige, utforske en helt ny verden av muligheter og muliggjøre alle de kreasjonene og ideene du har i hodet!
Er du klar til å starte skapelsen?
Klikk på her til å begynne med!
Artikler nevnt:
FLÁVIA FIGUEIRA ABURJAILE et al. Wild-Type and Genetically Improved Strains of Dairy Origin Probiotic as Potential Treatments for Intestinal Mucositis - 1. Tidsskrift for farmasi og farmakologi, v. 7, n. 4, 8 abr. 2019.
PESTANA-OLIVEIRA, N. et al. DOCA-salt hypertensjon og rollen som OVLT-sympatisk-tarmmikrobiom-aksen - 3. Klinisk og eksperimentell farmakologi og fysiologi, v. u.å., u.å., [s.d.].
SOUZA, M. C. DE; PÁDUA, T. A.; HENRIQUES, M. DAS G. Multippel organdysfunksjon under alvorlig malaria: Betennelsesresponsens rolle - 2. Aktuelle emner innen malaria, 30. november 2016.


Abonner på nyhetsbrevet vårt
Eksklusivt innhold av høy kvalitet om effektiv visuell
kommunikasjon innen vitenskap.