3 min lesning
03/19/2018
Vitenskapsbloggen Mind The Graph er ment å hjelpe forskere med å lære å kommunisere vitenskap på en ukomplisert måte.
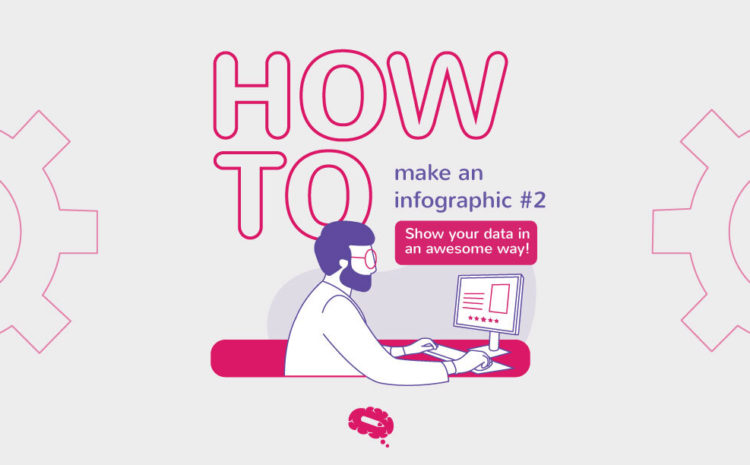
Dette er det tredje innlegget i serien Hvordan lage en infografikk. Hvis du gikk glipp av det forrige innlegget, kan du lese det her. Nå som du kjenner det brennende problemet ditt, hovedspørsmålet i forskningen din, og også har dataene som skal besvare dette spørsmålet, er det på tide å velge den beste måten å vise det på [...].
Hvordan lage en infografikkserie Dette er det andre innlegget i serien Hvordan [...].
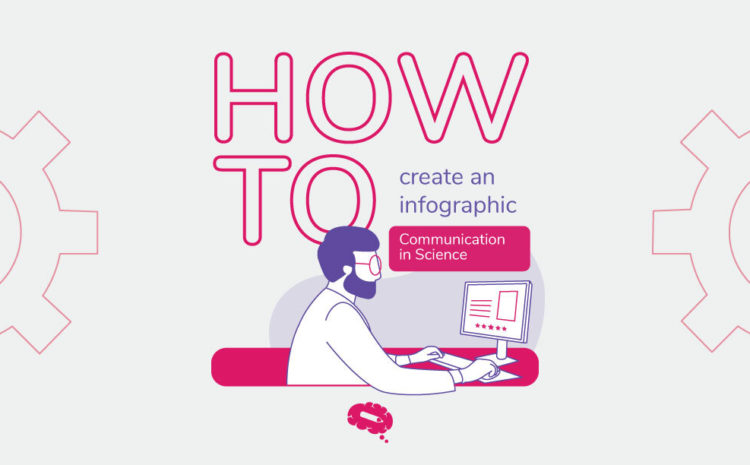
Finn ut hvordan du lager infografikk Kommunikasjon er en viktig del av det vitenskapelige livet. Og [...]
I dag feirer vi Darwins dag for å hedre Charles Darwins fødsel den 02.12.1809. Darwin [...]
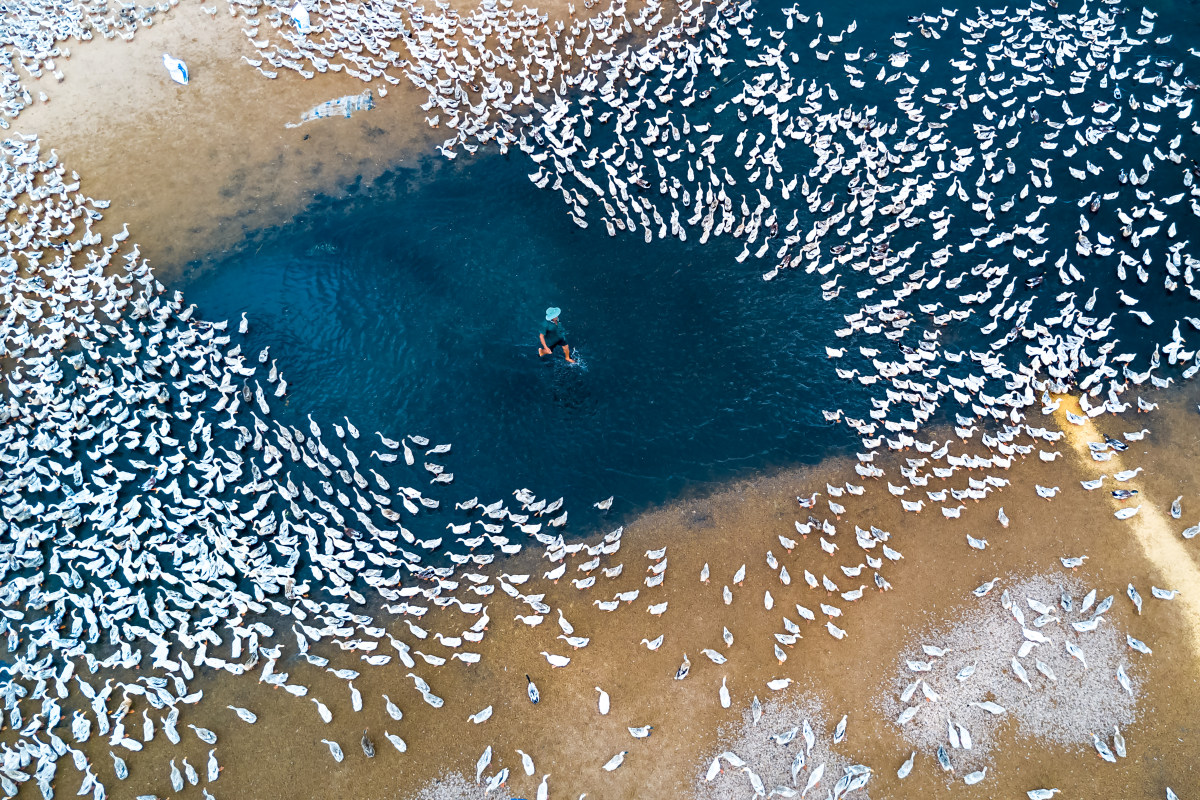
SkyPixel er verdens viktigste konkurranse i luftfotografering, og har mottatt over 44 000 [...].
A inovação científica e tecnológica se desenvolveu na velocidade da luz, enquanto a comunicação científica [...]
Som forsker kan man av og til oppleve uvanlige eller morsomme situasjoner i løpet av arbeidet. Rutinen med [...]
Hei, hei, hei! I dag vil jeg dele med deg mine favorittlenker om vitenskap som jeg har funnet ut i disse dager. [...]
Det er fredag, og vi fortjener en liten pause. Jeg vet at mange forskere jobber og skriver [...].
På film er haier vanligvis fryktløse rovdyr, kjøttsultne monstre. Men i virkeligheten er de [...].
Nesten like viktig som å ha solide forskningsresultater er det å presentere dem på en god måte. [...]
Du fortjener en liten pause på jobben for å se dette. Vitenskap er tross alt ikke bare [...].
Vi liker å vise frem brukernes utrolige arbeid - spesielt hvis de er [...].