2 min lesning
10/24/2018
Vitenskapsbloggen Mind The Graph er ment å hjelpe forskere med å lære å kommunisere vitenskap på en ukomplisert måte.
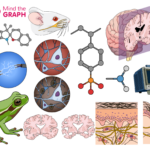
Hvordan kan du styrke forskningen din innen biovitenskap med grafiske sammendrag? Det er ikke lett å lage nøyaktige og vakre bilder av cellesignalveier. Jeg har allerede skrevet om hvordan de fleste Cell Press-tidsskrifter ber om et grafisk sammendrag, og hvordan dette kan være en hindring hvis du er forsker, men ikke designer. [...]
Illustrasjoner og infografikk er gode verktøy for å vise data og snakke om kontroversielle temaer som [...].
Barn har generelt et nysgjerrig sinn og mange spørsmål. Akkurat slik forskere skal være. Derfor [...]
Av og til får jeg e-poster fra forskere, ingeniører, lærere og andre fagpersoner som skriver: Å, jeg elsker [...]
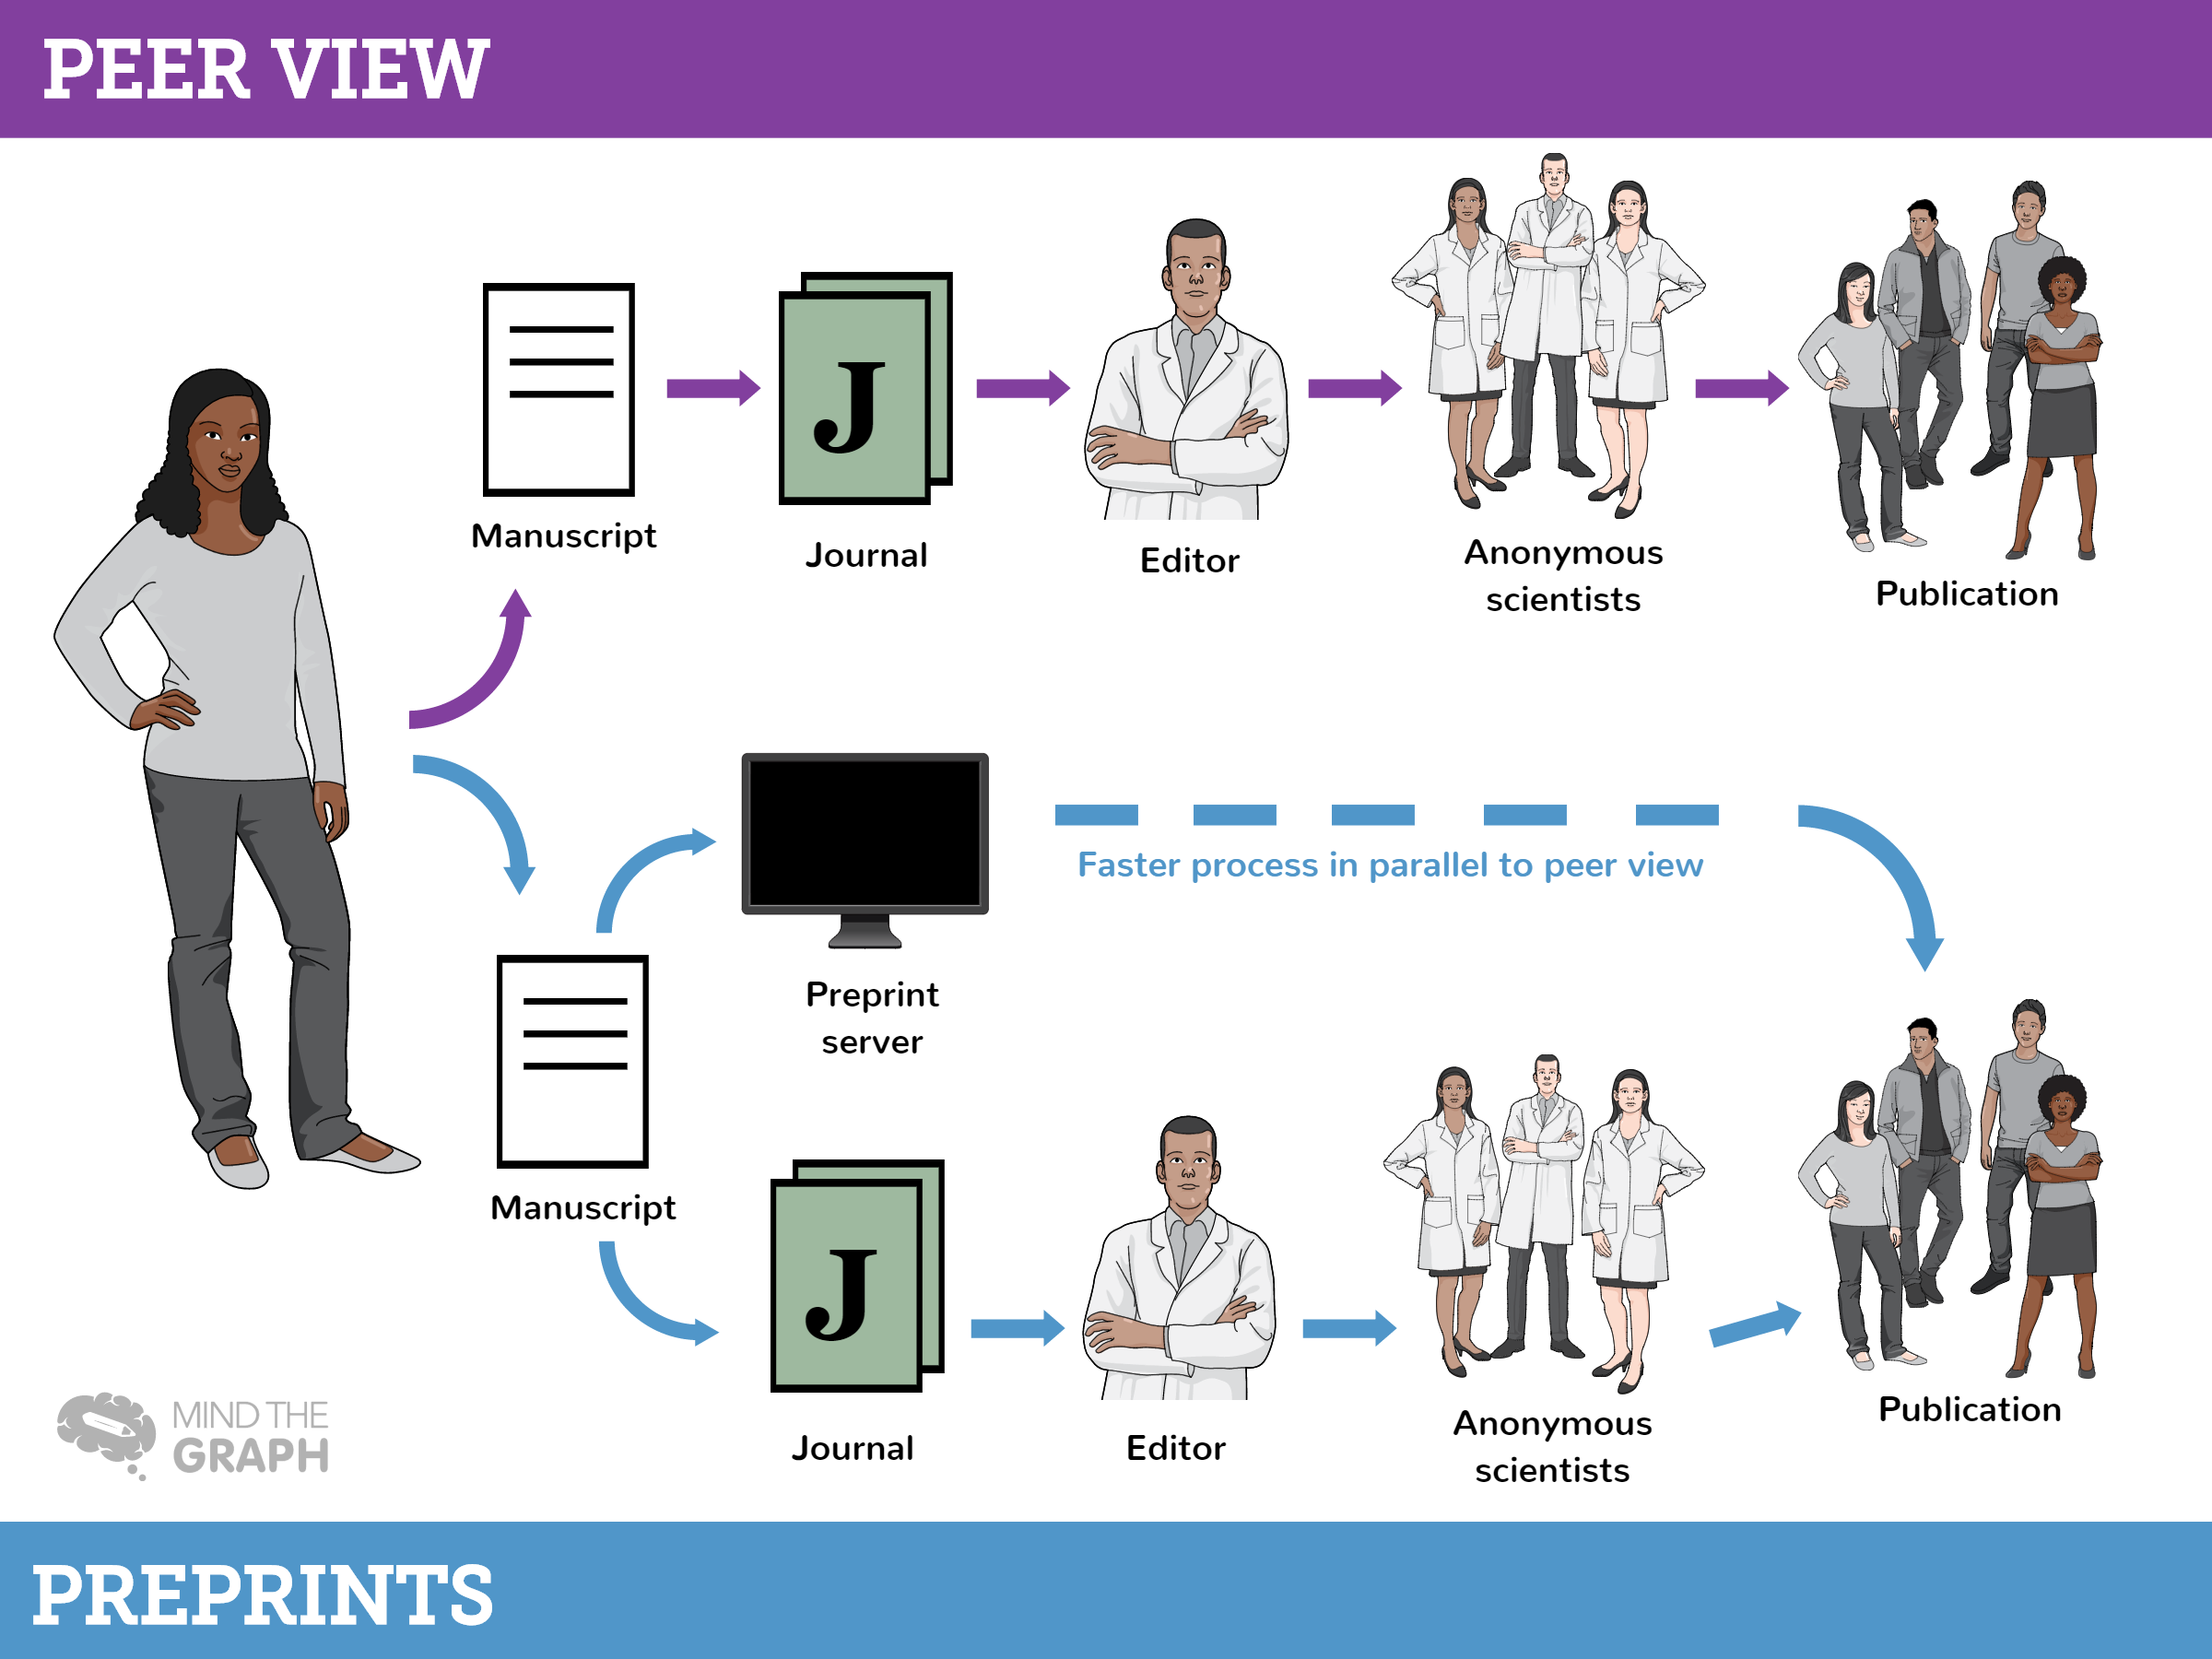
Vitenskapelig publisering. Bare en forsker kan forstå den blandede følelsen av å høre disse ordene. På [...]
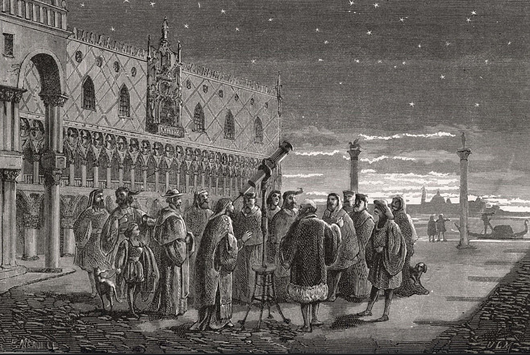
Vitenskapskommunikasjon har ikke alltid hatt som mål å bli publisert i tidsskrifter. Fra vitenskapens begynnelse har [...]
Til vår store overraskelse ble Mind the Graph nylig omtalt i et innlegg om meningsfulle strategier for digital merkevarebygging.
Hver dag overøses vi med informasjon i alle formater. Det har aldri vært enklere å [...].
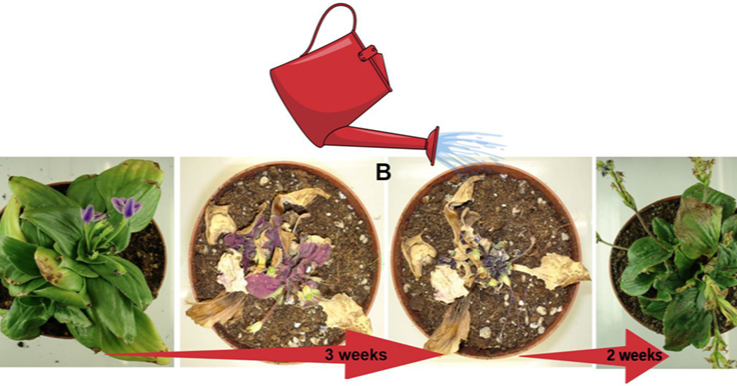
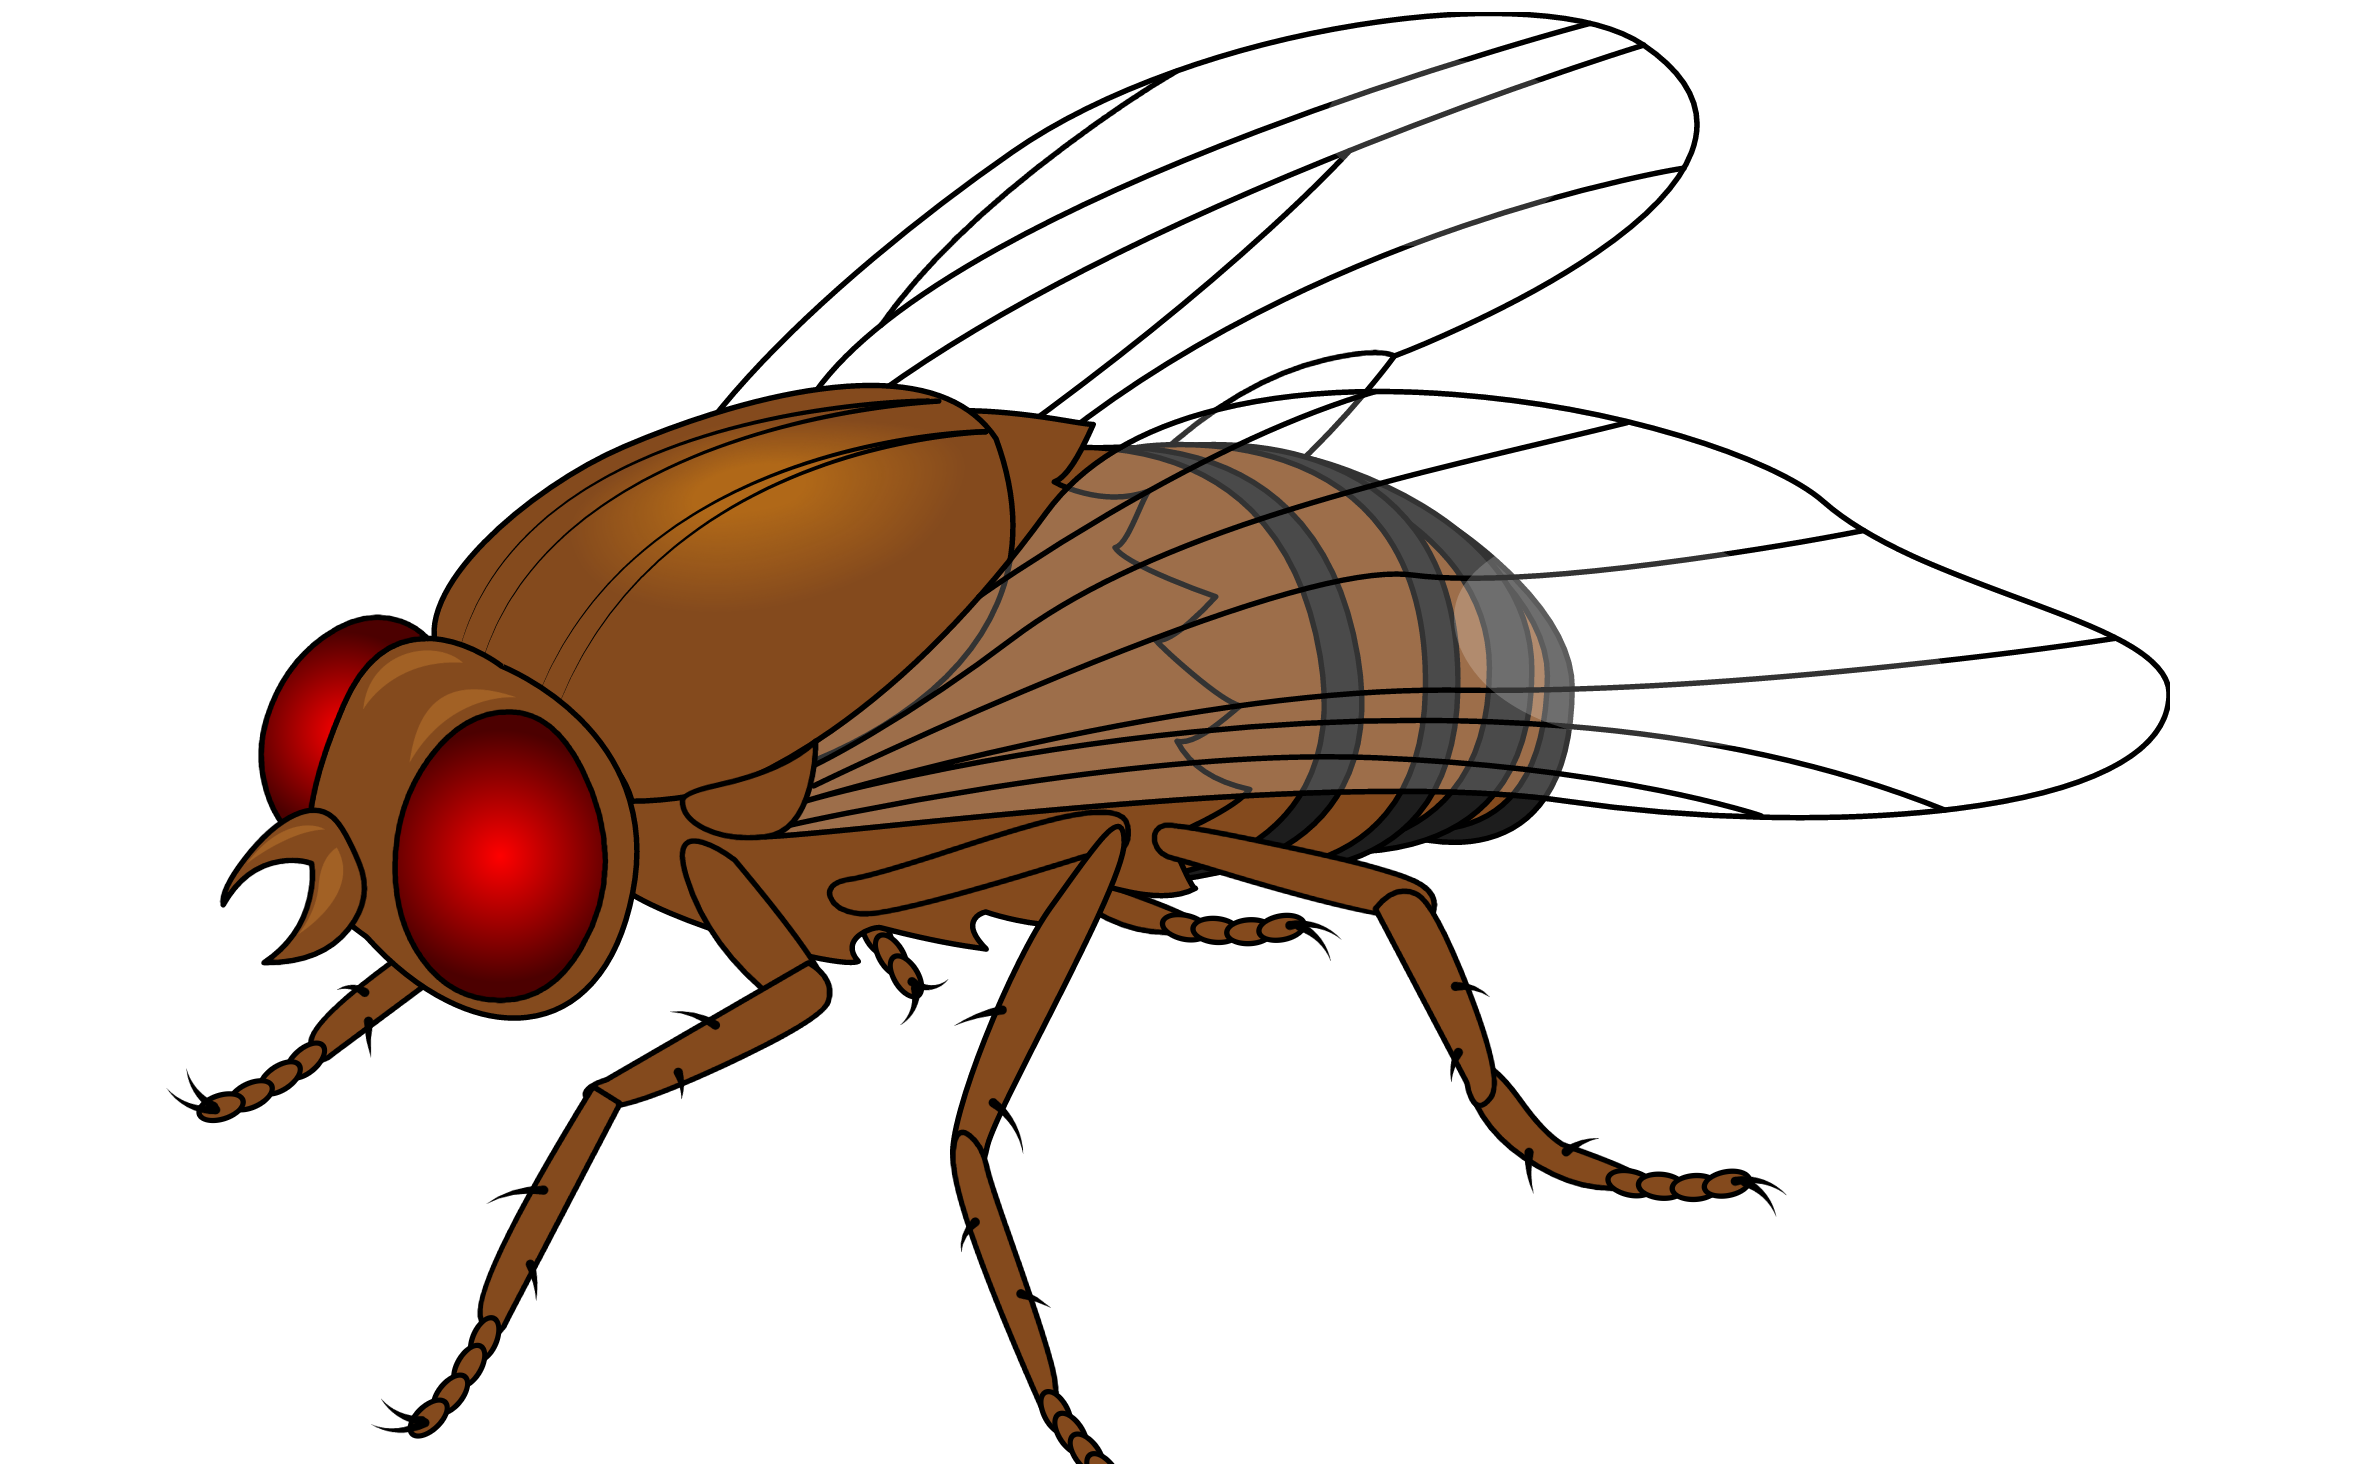
Drosophila melanogaster eller fruktfluer er en av de viktigste modellene innen medisin og [...].
Hva om du kunne kringkaste forskningen din til millioner av mennesker og gjøre arbeidet ditt til [...]?
Det vitenskapelige artikkelformatet var en revolusjon innen vitenskapen. Før det ble den vitenskapelige kommunikasjonen gjort [...].
Det er ikke gøy å publisere en artikkel som ingen noensinne kommer til å lese. I stedet er det [...]
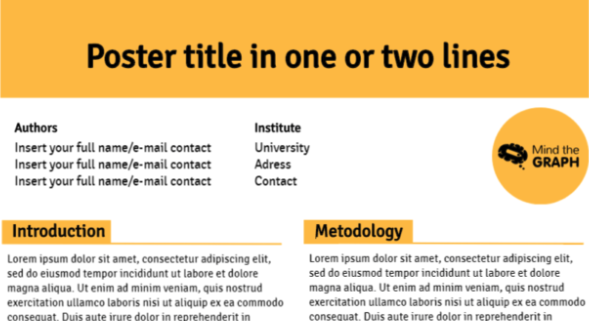
Å presentere en vitenskapelig plakat er en vanlig måte å kommunisere vitenskapelig forskning på. Det er en [...]