4 min lesning
12/13/2022
Vitenskapsbloggen Mind The Graph er ment å hjelpe forskere med å lære å kommunisere vitenskap på en ukomplisert måte.
Python er et av de mest populære programmeringsspråkene som vokser utrolig raskt. Forstå de mange fordelene når det gjelder forskning.
Forstå mer om empirisk skriving, inkludert definisjon og hva det innebærer: kvantitativ forskning, kvalitativ forskning og mer.
Lær hva parafrasering er, hvordan du parafraserer, og få tips til hvordan du gjør det for å unngå plagiat.
Det er på tide å lære om de aktuelle utfordringene i vitenskapssamfunnet og hvordan de påvirker kunnskapstilegnelsen.
Det er ofte vanskelig å oppdage feilene i en forskningsartikkel. I denne artikkelen kan du lese om ulike typer feil og hvordan du kan unngå dem i forskningsarbeidet ditt.
Vitenskap er ikke så vanskelig som du tror hvis du lærer det på riktig måte. Ta en titt på 10 YouTube-kanaler om naturvitenskap for å forbedre kunnskapen din.
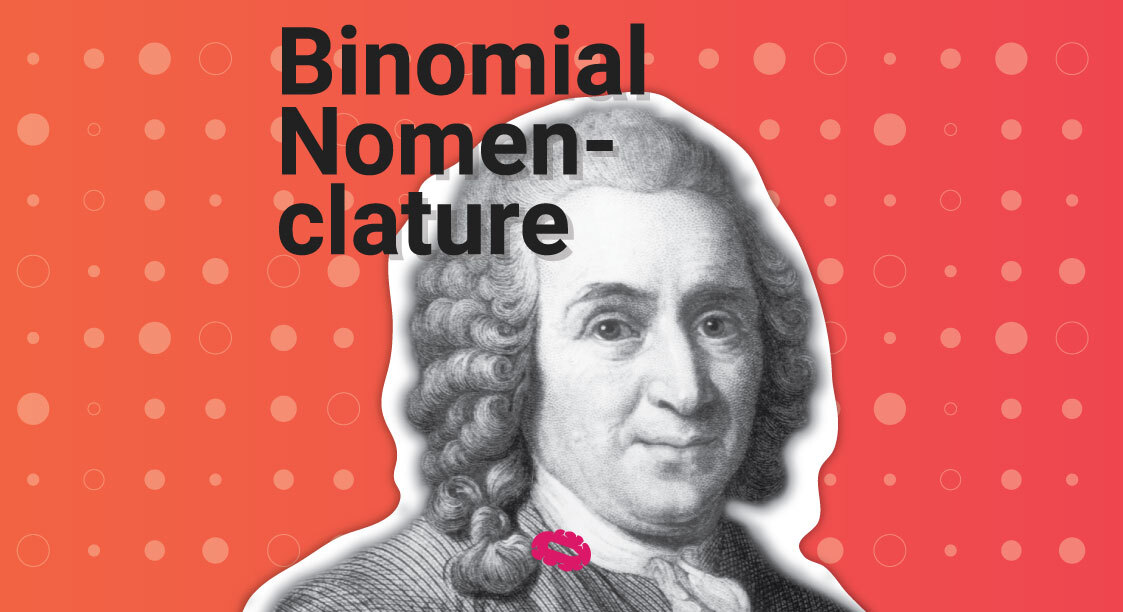
Forstå definisjonen av binomisk nomenklatur og se på noen eksempler på binomisk nomenklatur fra hverdagen.
Forstå definisjonen av binomisk nomenklatur og se på noen eksempler på binomisk nomenklatur fra hverdagen.
Lær mer om hva en problemformulering er, og hvordan du skriver en god problemformulering som oppsummerer hovedideen i essayet ditt.
Lær mer om kontekstuttalelser og hvordan de kan hjelpe deg med å komme inn på master- eller ph.d.-studiet.
Avhandling og hovedoppgave er ganske like og blir ofte forvekslet. I denne lettleste artikkelen kan du lese om forskjellene mellom dem.
Plagiat og brudd på opphavsretten er to forskjellige typer tyveri. Lær om ulike typer uetisk bruk og de viktigste forskjellene.
Denne Mind The Graph-guiden har som mål å lære deg å lage sitater på en enkel måte ved hjelp av APA-formatering.