12 min read
05/12/2024
Mind The Graph Scientific Blog is meant to help scientists learn how to communicate science in an uncomplicated way.
Embark on a journey of inspiration as you discover the powerful fusion of Martin Luther King’s legacy and scientific inquiry.
What is copyediting? In its simplest form, copyediting is the fine-tuning process that transforms written content into its best version. At its core, the role of a copyeditor is to enhance written material by correcting grammar, punctuation, and formatting errors.
In this guide, we’ll uncover the essence of copyediting, delving into its methods, techniques, and significance in the digital era. From the fundamental grammar rules to the intricate aspects of style, this article aims to make this complex world more accessible and comprehensible to all.
Copyediting stands as a meticulous process integral to refining written material to its highest standard. It represents a critical phase involving detailed scrutiny and enhancements that elevate content quality significantly. This process is pivotal in ensuring the precision, clarity, and coherence of written communication.
At its core, copyediting embodies a comprehensive review process aimed at refining written content. Its primary objective lies in enhancing the overall quality by meticulously rectifying errors, improving readability, and refining language structures. This stage serves to render text polished, error-free, and consistent in style and tone, aligning it with predefined quality benchmarks.
Within the editing continuum, the copyeditor assumes a pivotal role characterized by linguistic precision and exactitude. Their responsibilities transcend surface-level corrections as they meticulously examine the text, addressing grammatical inaccuracies, inconsistencies in style, and structural anomalies. The copyeditor refines the rudimentary form of a draft into a coherent, polished piece ready for dissemination.
By rectifying errors, enhancing sentence structures, and ensuring readability, copyediting guarantees the effective conveyance of the intended message, eliminating potential ambiguity or misunderstanding.
Engaging a professional copy editor yields multifaceted benefits, transcending mere error correction. Their expertise extends to elevating content quality, ensuring consistency, coherence, and adherence to prescribed style guidelines. Professional copy editors provide a fresh perspective, enhancing the overall impact and readability of written material.
Understanding the difference between copyediting and proofreading is pivotal in the editorial process. While often used interchangeably, these two stages play distinct and complementary roles in refining written content.
Copyediting and proofreading serve distinct yet interconnected purposes within the editing spectrum. Copyediting involves a comprehensive review aimed at refining and improving the substance, structure, and style of written content. It encompasses rectifying errors, improving clarity, and enhancing coherence to ensure the text meets established standards.
On the other hand, proofreading is the final quality check, focusing on surface-level errors such as typos, spelling mistakes, and minor formatting inconsistencies before publication.
The tasks involved in copyediting are multifaceted and involve a deep dive into the content. Copyeditors meticulously scrutinize grammar, syntax, punctuation, and style. They also focus on restructuring sentences, improving flow, checking for consistency, and ensuring adherence to prescribed guidelines.
In contrast, proofreading primarily involves a final review for typographical errors, spelling mistakes, minor grammatical issues, and inconsistencies in formatting.
A copyeditor’s work often involves substantial revisions aimed at refining the content’s structure, coherence, and overall readability. For instance, they might rephrase sentences to enhance clarity and conciseness. Here’s an example:
Original sentence: “The analysis identified a substantial correlation between the two variables, which was statistically significant.”
Copyedited sentence: “The analysis pinpointed a significant statistical correlation between the two variables.”
Conversely, a proofreader focuses on catching surface-level errors and inconsistencies. For example:
Original sentence: “The company’s success is built on innovative thinking dedication and hard work.”
Proofread sentence: “The company’s success is built on innovative thinking, dedication, and hard work.”
These examples highlight the distinct interventions made by a copyeditor and a proofreader, showcasing their specific contributions to refining written content at different stages of the editing process.
The methods and practices employed in copyediting constitute a structured approach aimed at refining written content across various dimensions. From rectifying grammatical errors to enhancing overall coherence, these methodologies ensure the text attains its highest quality.
Mechanical editing involves meticulous scrutiny of grammatical accuracy, punctuation usage, and adherence to formatting standards. Copyeditors focus on rectifying grammatical errors, such as subject-verb agreement, verb tense consistency, and proper usage of punctuation marks (commas, semicolons, etc.). Additionally, they ensure conformity to formatting guidelines, including consistency in font styles, margins, and spacing throughout the text.
Language and style editing aim to enhance the overall readability and coherence of the text. Copyeditors work on improving sentence structures, eliminating ambiguities, and enhancing clarity by rephrasing complex or convoluted sentences. They ensure consistency in tone, style, and vocabulary usage throughout the document to maintain a cohesive and engaging narrative flow.
Related article: Coherence And Cohesion: Writing Tips For Seamless Texts
Content editing involves a comprehensive assessment of the text’s structure and organization. Copyeditors analyze the overall flow of ideas, rearrange paragraphs for better coherence, and ensure logical progression within the document. They may suggest or implement structural changes to improve the readability and impact of the content, ensuring it resonates effectively with the intended audience.
Copyeditors rely on a diverse array of reference materials, style guides, and specialized tools to ensure accuracy and consistency. They consult authoritative sources such as dictionaries, grammar guides, and specific style manuals (like APA, MLA, Chicago Manual of Style, etc.) to maintain consistency in language usage, citation styles, and formatting standards. Additionally, they may utilize editing software and tools to streamline the editing process and ensure efficiency.
Now that the question ‘What is copyediting?” has been answered, here is a structured approach involving several steps to ensure a comprehensive copyediting process. This methodical endeavor embraces a series of meticulous steps, each dedicated to refining different facets of the text.” has been answered, here is a structured approach involving several steps to ensure a comprehensive copy editing process. This methodical endeavor embraces a series of meticulous steps, each dedicated to refining different facets of the text.
Before diving into the editing process, the copy editor must establish effective communication with the author or client. Understand their objectives, expectations, and any specific style guidelines required for the document. Clear communication helps define the scope of work, ensuring alignment with the author’s intentions and requirements.
Begin the editing process by conducting a comprehensive read-through of the text. Identify and rectify grammatical errors, including issues related to spelling, punctuation, and syntax. Correct inconsistencies and inaccuracies to ensure linguistic precision and adherence to language conventions.
Focus on improving the overall quality of the content by addressing issues related to sentence structure, clarity, and coherence. Enhance readability by restructuring sentences, eliminating ambiguities, and ensuring a logical flow of ideas throughout the text. Emphasize clarity of expression to effectively convey the intended message to the reader.
Conduct a meticulous review of the document’s formatting, ensuring consistency and adherence to prescribed guidelines. Verify the accuracy of citations, references, and any supplementary materials according to the specified style guide. Address any additional requirements specified by the author or client to ensure the document meets all expectations before finalization.
Self-editing and proofreading are indispensable skills for any writer aiming to refine their work to professional standards. Employing effective techniques, utilizing appropriate tools, and implementing key tips can significantly enhance the quality and clarity of written content.
Related article: 11 Best Grammar Checker Tools For Academic Writing
Related article: Peer Review Process: Understanding The Pathway To Publication
Mind the Graph is an invaluable resource for scientists, educators, and researchers, offering access to over 75,000 scientifically accurate illustrations across 80+ fields. Users benefit from a time-saving solution, effortlessly finding and customizing high-quality visuals that elevate presentations, research papers, and educational materials.

In the complex world of statistics, understanding the relationship between two variables is of utmost importance. If you are an analyst who is into statistics, you know how hard it is to understand such relationships. To make that easily understandable, this article is going to explore a certain method, Kendall’s Tau, a non-parametric measure that sheds light on the association’s strength and direction.
We aim to explain its complexities, applications, and significance, offering you a thorough comprehension of how it contrasts with other correlation coefficients and its varied applications across numerous fields.
Kendall’s Tau is a statistical measure designed to determine the strength and direction of the association between two variables. At its core, it quantifies the degree of correlation through the comparison of relative rankings within data pairs.
To put it simply, imagine you have two lists of your favorite movies ranked from best to worst. Kendall’s Tau helps you see how similar your ranking is to a friend’s. It does this by looking at each pair of movies and checking if both of you agree on which one is better or not.
The score it gives at the end tells you how much your tastes match. A score close to 1 means you almost totally agree, a score around 0 means your tastes don’t match much, and a score close to -1 means you usually disagree.
What’s amazing about Kendall’s Tau is that it doesn’t need things to be measured in numbers or perfectly lined up; it just needs the order you put them in.
Related article: What Are Statistics Parametric Tests And Where To Apply Them?
So, it’s a great way to compare rankings in a simple and effective way, whether you’re looking at movie preferences, sports team rankings, or any other list where you want to see how two sets of rankings compare. This makes Kendall’s Tau a favored tool for statisticians and researchers delving into the dynamics of non-linear relationships across diverse fields.
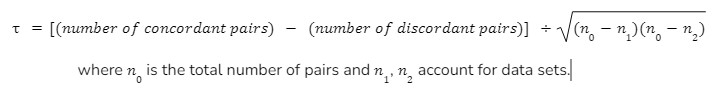
The mathematical formulation of Kendall’s Tau revolves around a simple yet insightful concept: it measures the relationship between two variables by comparing the ranks within their data sets.
At its heart, the formula looks at every possible pair of data points and categorizes them as either concordant (both elements of the pair are in the same order in both data sets) or discordant (the elements are in opposite orders).
The formula then calculates the difference between the proportion of concordant pairs and discordant pairs, normalized by the total number of pairs. This calculation yields a coefficient that ranges from -1 (indicating a perfect inverse relationship, where higher ranks in one set correspond to lower ranks in the other) to +1 (indicating a perfect direct relationship, where higher ranks in one set always correspond to higher ranks in the other).
A score of 0 suggests no correlation. This approach allows Kendall’s Tau to give a nuanced view of how two sets of rankings relate to each other as we saw in the last section, without requiring any assumptions about the distribution of the data, making it a robust and versatile tool for statistical analysis.
Mathematically, Kendall’s Tau is calculated as:
The history of Kendall’s Tau traces back to its starting point which was formulated by Maurice Kendall in 1938, and that proved to be the emerging point of a pivotal tool in the world of nonparametric statistics, designed to assess the correlation between two sets of data based on their ranks rather than their numerical value.
This innovative approach found its utility in a wide range of applications. For example, you can see it being extensively used in the financial sector, where analysts employ Kendall’s Tau to decipher the relationship between different investment assets, aiding in portfolio management by identifying assets that move together or inversely.
You can also see it being used in the environmental sector as well, researchers utilize it to understand the association between various ecological factors, such as the relationship between plant species and environmental gradients.
In order to understand Kendall’s Tau, you have to grasp its unique approach to measuring the relationship between two variables through their rankings. Unlike other correlation coefficients that require numerical values and often assume a linear relationship, Kendall’s Tau focuses on the order of data points, assessing whether pairs of rankings are in agreement (concordant) or disagreement (discordant).
Kendall’s Tau stands out for its simplicity and robustness, especially useful in situations where data do not meet normal distribution requirements or when dealing with ordinal data.
It is particularly valued for its non-parametric nature, making it less sensitive to outliers or non-linear relationships, thereby offering a clearer insight into the true nature of the relationship between variables.
This makes Kendall’s Tau a powerful tool in statistical analysis, capable of providing meaningful insights into the dynamics of various phenomena across a wide range of disciplines.
Let us now see the applications of Kendall’s Tau. They are vast and varied, stretching across numerous fields where understanding the strength and direction of relationships between variables is crucial.
This wide-ranging applicability makes Kendall’s Tau’s versatility as a statistical measure, capable of providing valuable insights into the dynamics of complex relationships in many contexts.
While highly versatile and robust, Kendall’s Tau is accompanied by distinct advantages and certain limitations that require careful consideration.
A major advantage of Kendall’s Tau is its non-parametric nature, allowing it to effectively analyze ordinal data and relationships without assuming a normal distribution, making it particularly valuable for small sample sizes or datasets with outliers. This attribute enhances its applicability across various disciplines, offering a reliable measure of association even in non-linear contexts. Furthermore, its simplicity and interpretability facilitate a straightforward understanding of the correlation between variables.
On the other hand, the limitations of Kendall’s Tau include its potential computational intensity with large datasets, as the pairwise comparison approach can become resource-intensive. Additionally, while its non-parametric nature is an asset, it may also limit the depth of insights into the nature of the relationship between variables, especially in cases where a parametric approach could offer a more nuanced understanding.
Despite these limitations, the balance of ease of use, robustness, and applicability positions Kendall’s Tau as a valuable tool in the statistical analysis arsenal, adept at navigating the complexities of ranking-based data analysis.
In conclusion, Kendall’s Tau offers a nuanced perspective on the association between variables, breaking the limitations set by the traditional correlation coefficients. Its adaptability across various fields emphasizes its importance in statistical analysis, providing researchers with a robust tool to decipher complex relationships. This article aimed to explain the intricacies of Kendall’s Tau, fostering a deeper understanding and appreciation of its capabilities and applications.
Have you ever wondered how some researchers and scientists make impactful posters and presentations using visuals even though they have limited knowledge of creating infographics? That’s possible by leveraging technology via tools like Mind the Graph.
Mind the Graph is a tool that has over 75,000 accurate scientific figures to boost your impact. And the best part is, it’s especially designed with the help of scientists and can be curated based on your needs. Check out the library of visuals by signing up to Mind the Graph and ace your research journey with utmost ease.
Data analysis, which guides decisions in a wide variety of domains, is a crucial part of statistics. Bayesian statistics have an intuitive and flexible framework, which distinguishes them from other statistical methodologies. Here’s a guide to Bayesian statistics for beginners, illuminating its foundational principles, practical applications, and inherent benefits. This article introduces the concept of Bayesian inference, which involves updating beliefs based on new evidence, to help readers understand its profound influence on decision-making. In this blog, we will demystify Bayesian statistics for beginners, and then show its relevance and utility in diverse real-world examples. Through clear explanations and illustrative examples, readers will gain a deeper appreciation for Bayesian methods and their significance in contemporary statistical practice.
In the realm of statistics, there exists a powerful framework that goes beyond mere numbers and p-values. With Bayesian statistics, probability is more than just a measure of frequency – it is a reflection of our beliefs and uncertainties. Bayesian statistics is based on the principles of priors, likelihoods, and posterior distributions, which will be explored in this blog post.
Bayesian statistics uses a different paradigm for analyzing probability data. Probability refers to our belief that an event is likely to occur, rather than its frequency. Three distributions make up Bayesian analysis: prior, likelihood, and posterior.
Bayes’ theorem is the cornerstone of Bayesian statistics, which guides the updating of our beliefs based on new evidence. With Bayes’ theorem, prior beliefs are combined with observed data to arrive at posterior probabilities. By formalizing inference, it refines our understanding of the world. This can be expressed mathematically as follows:
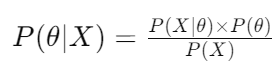
Bayesian theorem example from Wikipedia.
Bayesian inference is a fundamental concept of Bayesian statistics, which is used to make predictions, draw conclusions, and update beliefs based on evidence. Bayesian inference differs from frequentist inference by incorporating prior knowledge into the posterior distribution, which represents updated beliefs, by incorporating observed data.
Based on both prior knowledge and observed data, Bayesian inference estimates the probability distribution of unknown parameters. Here are some examples of Bayesian inference in action:
In Bayesian statistics, prior and posterior distributions play a pivotal role in updating our beliefs about parameters of interest in light of observed data. Let’s delve deeper into these concepts:
Prior distributions describe what we knew about the parameters before we observed any data. In the absence of observational evidence, they serve as a mathematical representation of uncertainty. Inferences made based on prior distributions can have a significant effect on the results.
As we estimate parameters, we use the prior distribution to reflect our understanding, experience, or subjective beliefs regarding these parameters. As a result, it guides posterior inference as a regularization mechanism. Depending on the strength of prior beliefs, the data may have varying degrees of influence on the final conclusion.
Different priors can have profound effects on posterior distributions. Consider a simple coin toss experiment as an example of estimating success rates. Even with limited data suggesting otherwise, the posterior distribution may still remain close to 0.5 if we have strong prior beliefs that the coin is fair. Conversely, a skeptical prior favoring extreme values might result in a posterior distribution reflecting that skepticism, despite overwhelming contrary evidence.
A posterior distribution represents our updated beliefs about a parameter after incorporating observed data. Based on Bayes’ theorem, the likelihood of the data given the parameters and their prior distribution are combined to compute them. A posterior distribution becomes increasingly dependent on the likelihood function as more data are observed, which quantifies how strongly different parameter values are supported by the data.
Hence, the posterior distribution reflects a synthesis of our prior beliefs and the observed data. The posterior distribution can then be used to make predictions about future events. It can also be used to compare different hypotheses and determine their likelihood of being true. The posterior distribution can also be used to make decisions and evaluate the consequences of different choices. It can also be used to allocate resources and optimize decisions.
Continuing with the coin toss example, we compute the posterior distribution of the coin’s bias based on a series of coin toss outcomes. In combination with our prior beliefs and the information provided by the observed data, this posterior distribution represents our updated belief about the coin’s bias.
Based on observed evidence, Bayesian models can be used to analyze data and make predictions by incorporating prior knowledge. As we proceed through this section, we will examine some key aspects of Bayesian modeling, including linear regression and hierarchical modeling. We will also discuss some applications of Bayesian models, such as causal inference and machine learning. Finally, we will discuss the strengths and weaknesses of Bayesian models.
In statistics, linear regression models the relationship between a dependent variable and an independent variable. The Bayesian framework extends linear regression by incorporating prior distributions over regression coefficients and errors. This allows for more accurate estimation of regression parameters and better handling of outliers. Additionally, Bayesian linear regression models can handle missing data and censored observations.
Key aspects of Bayesian linear regression include:
Bayesian linear regression offers several advantages, including:
The hierarchy modeling approach is a Bayesian approach that allows the modeling of complex data structures which have multiple levels of variability in terms of the underlying variables. In this method, parameters are arranged in a hierarchy, so that higher-level parameters capture variation at the group level, and lower-level parameters capture variation at the individual level. This allows researchers to estimate the effects of higher-level parameters without having to examine the effects of lower-level parameters. It also allows researchers to more easily identify patterns in the data that are difficult to spot with other methods.
Advantages of hierarchical modeling include:
By using Bayesian models such as linear regression and hierarchical modeling, researchers and practitioners can gain deeper insights while accounting effectively for uncertainty and prior knowledge.
Choosing the right Bayesian model for a dataset or problem is crucial when using Bayesian statistics. Based on observed data, Bayesian model comparison methodologies provide a rigorous framework for assessing the relative performance of competing models. In this section, we explore some of the key concepts involved in Bayesian model comparison.
Comparing Bayesian models involves evaluating the evidence provided by the data for each candidate model. By using probabilistic measures, Bayesian methods directly quantify the support for competing models, unlike frequentist approaches which often rely on hypothesis testing and p-values.
The concept of Bayes factors is at the heart of Bayesian model comparison. Bayes factors quantify the strength of evidence supporting one model over another, taking into account both the fit and complexity of the models. It represents the ratio of the marginal likelihoods of the two models under consideration. Evidence favoring the first model is indicated by a Bayes factor greater than 1, while evidence favoring the second model is indicated by a Bayes factor less than 1.
In Bayesian analysis, Bayes factors provide a principled approach to model selection. It is possible to identify the best model by comparing Bayes factors across different models, thus preventing overfitting and allowing robust inference to be made.
The cross-validation of Bayesian models is another effective tool for assessing their performance. A cross-validation process involves dividing the dataset into training and validation sets, fitting the model to the training data and then evaluating it on the validation data. Various subsets of data are used for training and validation, which allows for a more accurate estimation of the model’s accuracy.
A variety of cross-validation techniques can be used to assess model accuracy and generalization ability, including Bayesian cross-validation, LOO-CV, and K-fold cross-validation. These methods provide complementary information to Bayes factors by evaluating how well the models can make predictions on new, unseen data. These techniques also provide an estimation of how sensitive the model is to changes in the data, which can help to identify potential sources of bias.
By balancing model complexity and predictive performance with Bayesian factors and cross-validation methods, researchers can make informed decisions about model selection.
Bayesian statistics is a powerful and flexible framework for statistical inference and modeling, with advantages ranging from the ability to incorporate prior information to its robustness in handling uncertainty. Here are some advantages:
There are many advantages and limitations to Bayesian statistics, but they can be helpful when inferring and making decisions. For practitioners to apply Bayesian methods effectively, they must understand these aspects. Consider these key factors:
The Bayesian approach offers numerous advantages, but its implementation presents numerous challenges and limitations. Bayesian methods in various domains can be fully harnessed by practitioners who understand these aspects and apply appropriate strategies.
With this game-changer in academia, research and dissertations will be more straightforward. You can easily integrate visuals into your drafts using Mind the Graph‘s powerful tools, enhancing clarity and resulting in more citations. By involving your audience visually in your research, you can increase the impact and accessibility of your work. Mind the Graph is a powerful tool for creating compelling infographics which can be used to enhance your scientific communication. Visit our website for more information.
Assessing the reliability of academic journals is a fundamental concern for researchers navigating the ever-expanding landscape of scholarly publishing. The question, “Do you think this journal is reliable or not?” is one that undoubtedly resonates with researchers across disciplines, often prompting discussions with peers or mentors. In an environment rife with deceptive, fraudulent, or pseudo journals—synonymous with predatory publishing—navigating the terrain of publication ethics becomes increasingly complex. The proliferation of such predatory journals poses a significant threat to the integrity of academic discourse, undermining the credibility of scholarly research and eroding trust in the dissemination of knowledge.
Against the backdrop of exponential data generation and the pervasive pressure to publish, the imperative of selecting reputable journals for referencing and dissemination cannot be overstated. Researchers must be equipped with the tools and knowledge to discern between legitimate scholarly outlets and predatory enterprises masquerading as credible platforms for academic discourse. The ability to identify predatory journals is not merely a matter of academic prudence; it is a critical skill essential for safeguarding the integrity and credibility of one’s research contributions.
Recognizing the urgency of this challenge in the contemporary research landscape, it becomes imperative for researchers to cultivate an understanding of the indicators and markers that distinguish authentic scholarly journals from their predatory counterparts. By acquiring proficiency in discerning the authenticity and transparency of journals, researchers can mitigate the risks associated with predatory publishing and uphold the principles of academic integrity. This entails a multifaceted approach encompassing a thorough examination of various facets of journal credibility, ranging from editorial practices and peer review procedures to indexing status and publication ethics.
Key indicators of a reputable journal include a transparent and rigorous peer review process, clearly articulated editorial policies, and a distinguished editorial board comprising experts in the field. Legitimate journals typically adhere to established ethical guidelines, such as those outlined by organizations like the Committee on Publication Ethics (COPE), thereby upholding standards of integrity and transparency in scholarly publishing. Moreover, predatory journals often lack indexing in reputable databases and may engage in unethical practices such as plagiarism, falsification of data, or manipulation of citation metrics.
Related article: Peer Review Process: Understanding The Pathway To Publication
In conclusion, the ability to discern between reliable scholarly journals and predatory entities is indispensable for researchers seeking to uphold the integrity and credibility of their academic pursuits. By equipping themselves with the knowledge and tools necessary to identify deceptive publishing practices, researchers can navigate the scholarly landscape with confidence, ensuring that their contributions to the scientific community are disseminated through trustworthy and reputable channels. Let us help you understand the issue better.
Jeffrey Beall, a former librarian at the University of Colorado, Denver, coined the term “predatory journals.” He used to maintain a list of what he considered to be predatory publishers and journals, which he published on his blog. Beall defined predatory journals as those that exploit the open-access publishing model for profit without providing the expected level of editorial or publishing services. A website named Beall’s List still keeps an account of predatory journals and lists are updated now and then. However, it is to one’s discretion to search the journals and if to rely entirely on the list.
Also read: Pros and Cons of Open Access Publishing: Empowering Academics
Predatory Journals usually prioritize profit over the dissemination of credible research and can damage the integrity of academic publishing by allowing substandard or misleading research to enter the scholarly record. Identifying and avoiding predatory journals is important for researchers to ensure the quality and reliability of their work.
If we look at history it is difficult to point out to one single incident from where the evolution of predatory journals began. It was more due to the accumulation of more than one event which pointed towards the importance of peer review.
However, one early notable case often cited is the publication of a fake scientific paper by physicist Alan Sokal in 1996. Sokal submitted a nonsensical paper titled “Transgressing the Boundaries: Towards a Transformative Hermeneutics of Quantum Gravity” to the cultural studies journal “Social Text.” The paper was accepted and published, despite being full of jargon and nonsensical arguments. While this incident primarily highlighted issues within certain segments of cultural studies publishing rather than predatory publishing per se, it did raise questions about the rigor of peer review in certain academic disciplines.
Later, with the rise of the need to publish in the journal as an academic regulation, it became easy for publishers to tap into the need and the journal publication houses grew like mushrooms globally.
But how do we know whether the journals we are submitting our paper to are predatory or not? To help you with the process of identification, the following are the detailed characteristics of a predatory journal as identified by the researchers Elmore and Weston in 2020. Reading them carefully and recalling any of the experiences you had in your career will help you remember the characteristics better.
Predatory journals often advertise a Journal Impact Factor or other citation metric on their website, which may be incorrect or impossible to verify. These journals tend to not publish any impact factor on the website home page. If there are any numbers given on the home page the words used are not directly relatable as an impact factor. If there are links given for the explanation of the impact factor then go to the link and read the details. Look into three or five year impact factors and citations of the research papers published by the journal to understand the actual impact factor. A researcher can also find guidance on Journal citation reports from “Measuring your research impact: Journal Citation Reports (JCR)“.
These journals may promise an unrealistic timeline for publication, enticing authors with quick turnaround times that are often unattainable. A peer-reviewed journal will usually need a longer time period for publication as the reviewers will need at least 1-3 months to provide you with the reviewer’s comments.
Predatory journals publish all articles for which authors pay an Article Processing Charge (APC), regardless of quality, relevance to the journal’s scope, or coherence of content.
Articles in predatory journals frequently contain numerous grammar mistakes due to little or no copyediting, compromising the quality of published research.
Also read: Copyediting vs Proofreading: The Art Of Text Refinement
Editorial boards of predatory journals may include fictitious individuals, individuals lacking relevant credentials, or individuals unaware of their association with the journal, undermining the credibility of the publication.
Some predatory journals mimic the name or website of well-known legitimate journals, deceiving authors into submitting their work to illegitimate outlets.
Predatory journals aggressively target potential authors through spam emails, often inundating researchers with solicitations for submissions.
These journals may claim to have offices in one country while providing contact details located in another, adding to the lack of transparency in their operations.
Solicitation emails from predatory journals may contain grammatical errors reminiscent of phishing scams, further raising doubts about their legitimacy.
Lack of transparency about the acceptance process or APCs leaves authors unaware of the charges they will incur until their article is accepted, leading to potential financial exploitation.
Predatory journals may require authors to sign away their copyright to the article upon submission, preventing authors from submitting their work to other publishers.
Some predatory journals publish articles submitted before authors have signed publishing agreements, then refuse to remove the articles if authors withdraw their submissions.
Predatory journals may remove articles or entire journals from the web without warning or informing authors, potentially resulting in loss of access to published work and undermining scholarly integrity.
One would ask knowing that the journal is not reliable and may not provide needed editorial assistance, why would a researcher end up publishing with them? What would attract a researcher to go ahead and publish with a fraudulent publisher? Technically, nothing! You would wait until you get your chance and a good publisher is ready to take your research undervaluation. In our understanding, no causal factor can lead a researcher to waste their entire life and give it to a predatory publisher. But we do see that publications are happening. When we tried looking at the reasoning, we found the following to be the most prominent reasons.
In academia, there is often a strong emphasis on publishing research to advance one’s career, secure funding, or gain recognition. Authors under pressure to publish may be more susceptible to predatory journal solicitations, especially if they offer quick publication with minimal hurdles.
When it is the last year of your Ph.D and your convocation is dependent on the publication, it builds a lot of pressure on an individual. Under immense tension and pressure to graduate, there is a possibility that once might overlook certain indicators of predatory publishing and miss out on obvious emails with spelling mistakes.
It is required that mentors help the students out and help them power through the pressure and stick to a procedure for publication. Publishing with a renowned publisher and prestigious editorial board can bring a new light to the students’ career. All the efforts of a long research journey may need a last directional punch to look for the right publisher!
Lack of awareness can be a significant factor contributing to authors inadvertently publishing with predatory journals. Early-career researchers or those from regions with limited exposure to academic publishing practices may be unfamiliar with the existence or characteristics of predatory journals. Without proper guidance or mentorship, they may fall victim to deceptive practices.
Also, authors whose primary language is not English may face challenges in navigating the complexities of academic publishing, including identifying reputable journals. Predatory journals may exploit this vulnerability by targeting non-native English speakers with enticing offers and misleading information. Despite increasing efforts to raise awareness about predatory publishing, not all researchers are well-informed about the characteristics and risks associated with predatory journals. Without education on this topic, authors may inadvertently engage with predatory publishers.
By being vigilant and thorough in evaluating journals, researchers can avoid falling prey to predatory practices and ensure their research is disseminated through reputable channels. It is also important to avoid citing research articles from such journals for the most authentic bibliography creation. A researcher should also keep an eye as to restrict the use of such journals and make peers aware of it.
Avoiding predatory publishing is the first step towards your publication. Once you are through with it and have identified the journal you want to publish your research with, the most interesting journey awaits. Subscribe to our blog post for interesting insights into research article writing. Mind the Graph is here to help you with a lot of guiding articles and of course graphical abstract making to make your article interesting.
Our team would help you create stunning graphics to explain your research and get your best chances for publication as well. Reach out to us for any queries and try our platform for free here!
Martin Luther King Jr. was a towering figure in the civil rights movement of the 20th century, renowned for his unwavering commitment to nonviolent protest and his advocacy for racial equality and social justice. Through his eloquent speeches, including the iconic “I Have a Dream”, King inspired millions to join the fight against racial discrimination and systemic oppression. His tireless activism led to significant legislative victories, including the passage of the Civil Rights Act of 1964 and the Voting Rights Act of 1965, which helped dismantle institutionalized segregation and disenfranchisement.
Martin Luther King science enthusiasts can delve deeper into his legacy and impact on the civil rights movement by visiting “The Civil Rights Act of 1964 and the Voting Rights Act of 1965“.
Martin Luther King’s work and achievements resonate far beyond the realm of civil rights, serving as a powerful reminder of the enduring importance of justice, equality, and human dignity in society. King’s legacy reminds us of the vital role scientists play in addressing social and ethical challenges. His advocacy for equality and justice underscores the need for science to be inclusive, equitable, and socially responsible, with researchers actively working to address disparities and promote diversity in scientific fields. Like King, scientists have the potential to drive positive change and advance the collective well-being of society through their commitment to truth, integrity, and the pursuit of knowledge for the betterment of all.
Martin Luther King Jr.’s teachings on non-violence have influenced psychological studies, playing a fundamental role in research exploring the psychological mechanisms underlying peaceful resistance and social change. His advocacy for non-violent protest tactics, grounded in principles of love, empathy, and moral conviction, inspired psychologists to investigate the cognitive, emotional, and behavioral factors that contribute to the effectiveness of non-violent action.
Psychologists studying the civil rights movement sought to understand the psychological dynamics underlying these non-violent actions and their impact on social change. For example, research conducted by social psychologist Gordon Allport explored the role of intergroup contact and empathy in reducing prejudice and promoting positive attitudes toward racial integration. For more comprehensive information on Allport’s Intergroup Contact Hypothesis, please access “Allport’s Intergroup Contact Hypothesis: Its History And Influence“.
Additionally, studies by psychologist Philip Zimbardo examined the psychological processes that contributed to the success of non-violent protest tactics, highlighting the importance of moral conviction, solidarity, and collective action in mobilizing communities and effecting social transformation. These case studies underscore the profound influence of King’s teachings on psychological research on non-violence, providing valuable insights into the psychology of social movements and the promotion of peace and justice. For more details about Zimbardo’s study, visit: “Stanford Prison Experiment: Zimbardo’s Famous Study“.
Martin Luther King Jr.’s philosophy of non-violence has had a profound influence on sociological theories and studies, shaping scholarly understandings of social movements, power dynamics, and collective action. King’s advocacy for non-violent protest tactics, grounded in principles of love, empathy, and moral conviction, challenged prevailing notions of social change and resistance. Sociologists inspired by King’s teachings have explored the dynamics of social movements and the role of non-violent resistance in challenging systemic injustice and inequality.
King’s emphasis on the moral imperative of non-violence has prompted sociological inquiries into the ethics of social activism, the construction of collective identity, and the interplay between ideology and social change. Overall, King’s legacy continues to shape sociological theories and studies, offering valuable insights into the complexities of social movements and the pursuit of justice in contemporary society.
Sociologists have extensively studied this pivotal period in American history, analyzing the movement’s strategies, tactics, and outcomes through a sociological lens. Inspired by King’s emphasis on non-violent resistance, sociological research has explored how the civil rights movement mobilized diverse groups of individuals, challenged entrenched power structures, and galvanized public opinion to effect social change. For example, sociologist Aldon Morris, in his seminal work “The Origins of the Civil Rights Movement,” examines the role of grassroots activism and collective action in driving the movement forward, highlighting the importance of non-violent protest tactics in shaping its trajectory. Here you can find more information about Aldon Morris: “Dr. Aldon Morris on the Civil Rights Movement and its relation to Black Lives Matter“.
While Martin Luther King Jr. is primarily known for his leadership in the civil rights movement and his advocacy for social justice, he also shared insights on technology in some of his speeches and writings. In his speech “The American Dream,” delivered in 1961, King addressed the rapid advancements in technology and their impact on society. He acknowledged the potential of technology to improve living standards and enhance communication but also expressed concerns about its potential to exacerbate inequality and dehumanize individuals. King emphasized the importance of harnessing technological innovations for the betterment of humanity and urged for equitable access to technological resources.
His perspectives on technology resonate with contemporary debates surrounding the ethical implications of technological advancements, including issues such as the digital divide, privacy concerns, and the ethical use of artificial intelligence. King’s call for the ethical and responsible use of technology serves as a timeless reminder of the need to prioritize human dignity and social justice in the development and deployment of technological innovations in the present day.
Martin Luther King believed that science itself was neutral, meaning it was neither inherently good nor bad. Instead, its impact depended on the intentions and values of those who wielded it. He argued that when science was divorced from moral considerations, it could be used to perpetuate oppression and violence, exemplified by the development of deadly weapons.
However, King also saw the potential for science to be a force for positive change. He contended that when guided by ethical principles, particularly the ethic of love, science could contribute to the betterment of humanity. This included improving living standards, advancing our understanding of the world, and fostering unity among people. In essence, King advocated for a conscientious approach to scientific advancement, one that prioritized moral values and the well-being of society over mere technological progress.
One significant example of technology’s influence was the widespread use of television and radio broadcasts to disseminate King’s speeches and sermons to a national audience. Through televised appearances and radio broadcasts, King was able to reach millions of Americans, transcending geographical barriers and mobilizing support for the civil rights cause. Additionally, advancements in printing technology facilitated the distribution of pamphlets, flyers, and newsletters containing King’s writings and speeches, allowing his message to reach grassroots activists and communities across the country.
The use of telephone communication and telegraphy enabled civil rights organizers to coordinate protests, marches, and boycotts in real-time, facilitating the rapid mobilization of activists and amplifying the impact of non-violent resistance strategies. Overall, technology played a crucial role in amplifying King’s message and galvanizing support for the civil rights movement, demonstrating its power as a tool for social change and mobilization in the pursuit of justice and equality.
Martin Luther King Jr. did not extensively discuss science in his speeches or writings, but his broader philosophical views on justice, equality, and social change offer insights into his perspective on the role of science in society. King believed in the transformative power of knowledge and education as catalysts for social progress and liberation. While he did not explicitly address the role of science, his emphasis on critical thinking, empirical evidence, and moral reasoning suggests an implicit recognition of science as a tool for understanding and addressing social injustices. King likely viewed science as a potential force for liberation when employed ethically and responsibly to advance human welfare, promote equality, and challenge oppressive systems.
However, he may have also recognized the risk of science being co-opted or misused to perpetuate oppression, such as through the proliferation of discriminatory ideologies or technologies that reinforce existing power structures. King’s vision of a just and equitable society would likely have emphasized the importance of harnessing scientific knowledge and innovation in service of humanity, while also advocating for ethical guidelines and social responsibility to ensure that scientific advancements benefit all members of society. While King’s direct influence on the scientific community may be limited, his moral and ethical principles continue to inspire scientists and researchers to consider the broader social implications of their work and advocate for science as a force for positive change and liberation.
Martin Luther King Jr.’s contributions to the conversation on ethics in scientific research are multifaceted, rooted in his broader philosophy of justice, equality, and social responsibility. While King did not directly address ethical considerations in scientific research, his moral and ethical principles have undoubtedly shaped the ethical landscape of scientific inquiry.
One example of King’s influence is his emphasis on the inherent worth and dignity of every individual, which underscores the importance of respecting human rights and autonomy in scientific research. King’s advocacy for non-violence and social justice also highlights the ethical imperative for scientists to consider the potential social impacts of their research and to prioritize the well-being of marginalized communities. King’s calls for inclusivity and diversity in society resonate with efforts to promote diversity, equity, and inclusion in scientific research, emphasizing the importance of diverse perspectives and representation in shaping research agendas and priorities.
King’s commitment to truth and integrity in the pursuit of justice is a reminder to scientists of their ethical responsibility to conduct research with honesty, transparency, and integrity, and to uphold ethical standards in all aspects of their work. Overall, while King may not have directly addressed ethical considerations in scientific research, his moral and ethical principles have undoubtedly influenced the ethical landscape of scientific inquiry, inspiring scientists to consider the broader social implications of their work and to strive for ethical excellence in their research endeavors.
Mind the Graph platform offers invaluable support to scientists by providing access to a vast library of over 75,000 accurate scientific figures. This comprehensive collection equips researchers with a diverse range of high-quality visuals, including diagrams, illustrations, and charts, which they can seamlessly integrate into their work. By leveraging these visually compelling resources, scientists can enhance the clarity and effectiveness of their presentations, papers, and communications, thereby significantly boosting their impact within their respective fields.
In an era dominated by the pressing challenges of climate change, the agricultural landscape is experiencing dramatic instability in order to ensure resilience, sustainability, and production. This article explores the complexities of Climate-Smart Agriculture (CSA), a concept that integrates adaptation, mitigation, and resilience into agricultural practices.
As global temperatures increase and weather patterns vary, the need to create a sustainable and climate-resilient agriculture future has never been more urgent. This examination attempts to shed light on why adopting climate-smart agriculture is not simply an option, but an essential step in securing our food supply and cultivating a planet-friendly agricultural paradigm.
As the Earth’s climate continues to adapt in unexpected ways, agriculture finds itself at the forefront of a rapidly changing world. The delicate dance between climate change and agriculture is a dynamic and multifaceted interaction that reshapes not just existing agricultural practices but also has a significant impact on the future of food production.
Climate change, in its various behaviors, has a complex impact on agriculture, sending ripples through both the current and future prospects of this critical sector. The complex interplay emerges as a story of difficulties and adjustments, necessitating a closer look at how farming practices must evolve to meet the demands of an ever-changing climate.
Let’s look at the dynamic interaction between climate change and agriculture, studying the subtle ways in which these forces intersect and shape the agricultural landscape.
Agriculture, crucial for human existence, paradoxically contributes significantly to climate change. This relationship involves the emission of greenhouse gasses, deforestation, land-use change, and substantial energy consumption.
In response to the challenges posed by climate change, the agricultural sector is embracing innovative practices that not only adapt to the changing climate but also contribute to mitigation efforts. These climate-smart agriculture practices prioritize sustainability and resilience.
Climate-Smart Agriculture (CSA) is an integrated and adaptive farming approach that aims to address the problems of climate change while promoting sustainable and resilient agricultural practices. It entails the coordinated implementation of initiatives that increase production, reduce greenhouse gas emissions, and strengthen resistance to the effects of climate change.
The examples below showcase how each climate-smart agricultural practice contributes to enhanced resilience, sustainability, and adaptability in the face of a changing climate.
Implementing climate-smart agriculture necessitates the adoption of strategic practices and principles aimed at bolstering agricultural resilience, mitigating the impacts of climate change, and ensuring long-term sustainability. Here are key strategies to effectively implement climate-smart agriculture.
By systematically incorporating these strategies, collaboration among farmers, policymakers, and communities can contribute to the creation of a resilient and sustainable agricultural system, well-equipped to thrive in the face of challenges posed by climate change.
In tackling the severe challenges posed by climate change, agriculture is at a crossroads that requires innovation, resilience, and a relentless commitment to sustainability. The discussion of Climate-Smart Agriculture (CSA) in this article shows a dynamic approach that seamlessly incorporates adaptation, mitigation, and resilience into agricultural practices.
As global temperatures increase and weather patterns vary, the need to create a sustainable and climate-resilient agricultural future becomes evident.
Climate change and agriculture have a complex relationship, including temperature extremes, changing precipitation patterns, water scarcity, and increased pest pressure all having an impact on present practices. Looking ahead, expected shifts in growing zones, reducing crop diversity, severe weather events, and global food security issues create a difficult picture that demands proactive measures.
Recognizing agriculture’s paradoxical role in climate change, with considerable contributions to greenhouse gas emissions, deforestation, and energy use, emphasizes the importance of transformative actions. Climate-Smart Agriculture emerges as a comprehensive solution to solving agriculture’s multiple challenges.
However, this revolutionary journey is not without challenges. Limitations in financial resources, technological obstacles, unwillingness to change, and policy uncertainties must all be addressed.
The path forward requires collaborative action, innovation, and a steadfast commitment to establishing an environmentally responsible agriculture paradigm.
Mind the Graph unlocks the power of visual communication, bringing your creations to life in minutes! Mind the Graph’s efficiency is evident in its pre-designed templates and straightforward drag-and-drop features, guaranteeing that your visuals are not only impactful but also created with unmatched ease. Improve your communication skills in business, academia, and education – Mind the Graph transforms your thoughts into visually stunning masterpieces!
In today’s world of scientific research, the power of visual communication cannot be underestimated. The ability to present complex data in a visually appealing and easily understandable manner is crucial for effectively conveying research findings. This is where Mind the Graph comes in. Mind the Graph is an online platform that is revolutionizing scientific data visualization. Targeting scientists and researchers, the platform provides a user-friendly interface for creating visually captivating scientific figures, infographics, graphical abstracts, presentations, and posters. It caters to individuals, small labs, and large organizations, making it accessible to a wide range of audiences within the scientific community. What sets Mind the Graph apart is its ability to address the challenge researchers face in visualizing complex scientific data without specialized design skills. By offering a range of intuitive tools and educational infographic templates, the platform empowers researchers to easily create visually engaging visuals that enhance scientific communication. In doing so, Mind the Graph is redefining the way scientific research is presented and shared, ultimately propelling scientific advancements forward.
The primary purpose of Mind the Graph is to simplify the process of scientific data visualization. The platform is designed to make complex scientific data more digestible by transforming it into visually appealing and easily understandable graphics. The goal is to aid researchers in disseminating their findings more effectively and engagingly, thus facilitating better comprehension and enhancing the impact of their work.
Mind the Graph is on a mission to democratize scientific data visualization by providing an intuitive interface and versatile tools that do not require any advanced design skills. This accessibility allows researchers to focus on their core work, with the assurance that they can efficiently and accurately depict their data in a visually compelling manner.
Ultimately, the platform aims to advance scientific communication by bridging the gap between complex data and its comprehension. By enabling clear and captivating visualization of scientific data, the tool is contributing significantly to the proliferation of knowledge in the scientific community, fostering collaboration, and accelerating scientific advancements.

The primary target audience of Mind the Graph encompasses a broad spectrum of the scientific community. This includes individual researchers, small research labs, and large scientific organizations. The platform’s utility is not confined to a specific scientific discipline, making it an invaluable tool for scientists across various fields of study, including biology, physics, chemistry, and earth sciences, among others.
In addition to scientists and researchers, the platform also caters to educators in the scientific domain. Professors, lecturers, and teachers can use Mind the Graph to create visually engaging teaching materials that can aid in the effective transmission of scientific concepts to their classrooms and various class of students.
Moreover, Mind the Graph is equally beneficial for science communicators and journalists who need to convey scientific information to a general audience in a visual way that is easy to understand yet accurate. By transforming complex scientific data into visually appealing infographics and figures, they can ensure that the scientific content is accessible and engaging for all.
To sum up the advice in this blog post, anyone who deals with scientific data and requires visually compelling graphics to present their information effectively can benefit from using Mind the Graph.
A standout feature of Mind the Graph is its dedicated focus on user-friendliness. Recognizing that not all scientists and researchers have advanced design skills, the platform is designed to be easily navigable and intuitive. This ensures that users can create visually compelling scientific figures, infographics, and presentations without having to grapple with a steep learning curve.
The platform provides a wide array of pre-designed infographic templates that cater to various needs and research fields. Users can effortlessly select a full infographic template that suits their requirements and then customize it with their data. This simplicity is complemented by a robust set of tools that allows users to modify and adapt graphics to their specific needs, all within a straightforward and user-friendly interface.
Moreover, novices in data visualization are not left stranded. Mind the Graph also offers a wealth of free educational resources, including tutorials, tips and guides, to help users get up to speed with the platform and the principles of effective data visualization. This commitment to user-friendliness ensures that Mind the Graph can be a potent tool for any scientist or researcher looking to enhance their scientific communication with impactful visuals.

In the realm of scientific research, communication is key. The ability to effectively convey research findings not only enhances understanding but also drives the scientific discourse forward. Mind the Graph is playing a crucial role in this aspect, by transforming scientific communication into a more engaging experience.
Visuals carry an inherent advantage in communication: they are processed much faster by the human brain than text. By leveraging this, Mind the Graph enables researchers to present their complex data in visually appealing formats, using examples such as infographics, graphical abstracts, and figures. This visual approach not only enhances the understanding of the data but also captures and holds the audience’s attention, thus making the communication more engaging.
Moreover, the platform’s easy-to-use interface and customizable templates give researchers the freedom to express and explore their creativity in their presentations. This adds a unique touch to their work, making it more appealing to the audience and setting it apart from conventional scientific presentations.
In essence, Mind the Graph is redefining scientific communication by making it more visually engaging, thereby enhancing the impact and reach of scientific research.
Data visualization in scientific research often poses numerous challenges, especially when dealing with complex data sets. Researchers may struggle with deciding how best to represent their data, ensuring accuracy in representation, and making the visuals appealing and understandable. Mind the Graph addresses these challenges head-on, providing a quick look at practical solutions for researchers.
The platform offers a variety of pre-designed templates that can cater to different types of data and research fields. These templates serve as a starting point, taking away the initial hurdle of deciding how to represent the data. From there, the intuitive tools and features allow researchers to customize multiple versions of the templates to fit their specific data and research findings accurately.
Furthermore, Mind the Graph understands the importance of making scientific data accessible and understandable to a broad audience. To this end, the platform’s interface and tools are designed to help researchers create visually appealing and easily comprehensible graphics. This includes features like color selection, font options, and shape customization that can significantly enhance the visual appeal and clarity of the data representation.
In essence, Mind the Graph acts as a valuable ally for researchers, helping them overcome the common challenges associated with scientific data visualization.
The integration of Mind the Graph into the scientific research process is straightforward and beneficial. Given the platform’s user-friendly interface and an array of tools and templates, researchers can easily incorporate it into their workflow to create compelling visual representations of their data.
The process begins with the selection of a template that aligns with the researcher’s specific needs. Once a template is selected, researchers can input their data, modify graphics, and customize the visual elements to accurately represent and explain their findings. The platform’s set of tools allows for fine-tuning of details, ensuring the created visuals reflect the data accurately and convey information most effectively.
Beyond the visualization of research data, Mind the Graph can also be utilized for creating engaging presentations and posters for conferences and meetings. By leveraging the platform’s capabilities, researchers can ensure their work stands out and is well-received by their peers, thereby enhancing their scientific communication and impact.
In summary, integrating Mind the Graph into the research process can significantly enhance the visualization and presentation of scientific data, thereby aiding in the effective communication and dissemination of research findings.

Visual communication in scientific research plays a significant role in enhancing accessibility and engagement. By transforming complex data into visually appealing and easily understandable graphics, researchers can effectively communicate their findings to a much broader audience.
Mind the Graph facilitates this process, providing an array of tools and infographic templates that allow for the creation of engaging visual representations of scientific data. This not only makes the data more digestible but also makes scientific findings more approachable for individuals without a scientific background. This accessibility is crucial in today’s interconnected world, where scientific findings often have widespread implications beyond the scientific community.
Moreover, visually engaging graphics can significantly increase the engagement of the audience. By capturing the audience’s attention and facilitating understanding of complex concepts, visuals can stimulate discussion, encourage sharing of the findings, and even inspire further research. In this way, visual communication, facilitated by platforms like Mind the Graph, can significantly enhance the impact and reach of scientific research.
Ultimately, the use of visual communication in scientific research, particularly through user-friendly platforms like Mind the Graph, can greatly contribute to the accessibility and engagement of research findings.

The use of visual communication in scientific research, particularly through platforms like Mind the Graph, brings multiple advantages for the scientific community. Foremost among these is the enhancement of scientific communication. By transforming complex data into visually appealing graphics, researchers can effectively communicate their findings to their peers, fostering better understanding, and stimulating scientific discourse.
Moreover, the accessibility provided by visual communication opens up the scientific community to a broader audience. This can lead to increased public interest and understanding of scientific research, fostering a culture of scientific literacy, education and appreciation.
Visual communication also facilitates interdisciplinary collaboration. By presenting data in a visually understandable format, researchers can effectively communicate their findings to colleagues from different scientific disciplines. This can lead to collaborations that bridge disciplines, fostering innovation and advancement in scientific research.
Lastly, the use of platforms like Mind the Graph can enhance efficiency within the scientific community. By providing an efficient and easy-to-use platform for data visualization, researchers can save time and resources that can be better utilized for their core research activities.
In essence, the use of visual communication in scientific research, particularly through platforms like Mind the Graph, has the potential to significantly enhance the effectiveness, reach, and efficiency of the scientific community.
The impact of visual communication in scientific research, facilitated by platforms like Mind The Graph, is best illustrated through success stories and testimonials from the scientific community.
Many researchers have lauded the platform for its user-friendliness and effectiveness in communicating complex data. For instance, a researcher in the field of genomics expressed how the platform enabled them to visually represent intricate genomic sequences in an understandable and visually appealing manner. This not only enhanced the researcher’s presentation but also stimulated engaging discussions and ideas among peers.
Educators in the scientific domain have also praised Mind the Graph. A biology teacher and professor used the platform to create engaging classroom teaching materials, noting that the visually appealing and understandable graphics significantly enhanced students’ engagement and comprehension of complex biological concepts.
Similarly, a science communicator recounted how the platform allowed them to effectively convey complex scientific findings to a general audience. The use of visually captivating educational infographics facilitated understanding and stimulated interest among readers, enhancing the impact of their professional science communication efforts.
These success stories and testimonials underscore the significant benefits of visual communication in scientific research, particularly when facilitated by user-friendly, fun and effective platforms like Mind the Graph. Sign up for free and try it now!
With the rapid dissemination of content across various platforms, accuracy and clarity are essential. In today’s information-driven world, both copyediting and proofreading play relevant roles in ensuring the credibility and effectiveness of written communication. Copyediting refines the overall quality of content, making it clear, coherent, and engaging, essential qualities amidst the abundance of information. Conversely, proofreading acts as the final safeguard, preventing errors that could undermine the message’s credibility. In an era where information is swiftly consumed and shared, the joint efforts of copyediting and proofreading guarantee not only error-free content but also an effective conveyance of intended messages, fostering trust and reliability in the exchange of instant information.
Copyediting is an editorial process to refine written content to achieve clarity, coherence, and adherence to established style guidelines. As an intermediary between the author’s intent and the audience’s understanding, a copyeditor performs diverse tasks, including grammar and syntax correction, ensuring style consistency, enhancing overall clarity and coherence, fact-checking for accuracy, refining language, and adjusting formatting elements. This multifaceted role contributes to the transformation of a manuscript into a polished, error-free, and professionally presented final product.
Grammar and Syntax: Correcting grammatical errors, ensuring proper sentence structure, and eliminating syntax issues to enhance readability.
Style Consistency: Enforcing consistency in language usage, formatting, and adherence to a specific style guide.
Clarity and Coherence: Improving the overall clarity and coherence of the text by reorganizing or restructuring sentences and paragraphs.
Fact-Checking: Verifying factual accuracy, data, and references to uphold the credibility of the content.
Spelling and Punctuation: Ensuring accurate spelling, proper punctuation, and adherence to established conventions.
Language Polishing: Refining the language to align with the intended tone, audience, and purpose of the document.
Formatting and Layout: Reviewing and adjusting formatting elements to create a visually appealing and consistent presentation.
Proofreading is the final and meticulous stage of the editorial process, dedicated to the comprehensive review and correction of written content before publication. Serving as the ultimate quality control, a proofreader plays a pivotal role in ensuring accuracy and clarity by meticulously addressing grammatical, spelling, and punctuation errors, maintaining consistency in language and formatting, and cross-checking details for factual accuracy.
Grammar and Spelling: Correcting grammatical errors, identifying and rectifying spelling mistakes, and ensuring the proper use of punctuation.
Consistency: Verifying and maintaining consistency in language usage, formatting, and style throughout the document.
Typography and Formatting: Checking for typographical errors, ensuring consistent font usage, and reviewing overall document formatting for a polished appearance.
Accuracy in References: Verifying accuracy in references, citations, and other factual elements to uphold the document’s reliability.
Cross-Checking Details: Carefully cross-referencing details, such as names, dates, and numbers, to ensure accuracy and coherence.
Final Readability Check: Conduct a final check for overall readability and coherence, addressing any lingering issues that may impact the document’s clarity.
Copyediting vs Proofreading contrasts two distinct processes in editing written content. While both copyediting and proofreading contribute to the refinement of written content, their primary objectives and focus areas vary. Copyediting aims to elevate the overall quality of the text by addressing issues related to style, organization, and language use. Proofreading, on the other hand, is specifically focused on eliminating errors that might have been overlooked in earlier stages, with a primary emphasis on correctness and adherence to language conventions.
Copyediting involves a higher level of detail and a broader scope, requiring a comprehensive understanding of the document’s context, style, and intended audience. It may involve restructuring sentences, improving transitions, and ensuring consistency throughout the text. In contrast, proofreading is more detail-oriented, focusing on catching and correcting individual errors without making significant changes to the overall structure or style. Together, these processes contribute to the creation of polished, error-free, and professionally presented written material.
Original Sentence: “The conference will commence at 2 pm, and attendees are requested to be punctual.”
Copyedited Version: “The conference will start at 2:00 PM, and attendees are urged to be punctual.”
Explanation: In this example, the copyeditor improved clarity by specifying the time format, adjusted wording for formality, and replaced “commence” with the more common “start.”
Original Passage: “Despite the myriad of challenges faced by the organization, they have managed to persevere and overcome each obstacle.”
Copyedited Version: “Despite the numerous challenges faced by the organization, they have persevered and overcome each obstacle.”
Explanation: The copyeditor simplified the expression by replacing “myriad of” with “numerous,” making the sentence more concise and easier to understand.
Original Sentence: “The reporrt was submitted before the deadline.”
Proofread Version: “The report was submitted before the deadline.”
Explanation: The proofreader corrected the spelling error in “report,” ensuring accuracy in the final version of the document.
Original Paragraph: “The company’s profit margin increased by 15% in the last quartet.”
Proofread Version: “The company’s profit margin increased by 15% in the last quarter.”
Explanation: The proofreader identified and rectified the typographical error in “quartet,” replacing it with the correct term, “quarter.”
Spelling and Grammar Errors: Common typos, misspellings, and grammatical mistakes are often overlooked but can significantly impact the clarity and professionalism of the text.
Inconsistencies in Style: Ensure uniformity in language, formatting, and style throughout the document, especially when dealing with numbers, dates, and citations.
Ambiguous Phrasing: Look out for sentences or phrases that may be unclear or ambiguous to readers. Clarify and rephrase for better comprehension.
Redundancy and Wordiness: Eliminate unnecessary words and phrases to improve the document’s clarity and conciseness.
Create a Checklist: Develop a personalized editing checklist to systematically review different elements, ensuring that nothing is overlooked during the editing process.
Maintain Version Control: Keep track of edits and revisions to avoid introducing new errors during the editing process. Maintain a clear version history for reference.
Seek Feedback: Collaborate with peers or colleagues to gain fresh perspectives on the document. External feedback can provide valuable insights and catch overlooked errors.
Pay Attention to Detail: Be meticulous in examining punctuation, spacing, and formatting details. Consistent attention to detail contributes to a polished final product.
Professionals are the guardians of language precision, meticulously refining documents to meet the highest standards. These professionals act as critical contributors to the editorial process, holding the responsibility of upholding the credibility and professionalism of any written work.
Language Proficiency: A deep understanding of grammar, syntax, and language conventions is fundamental for effective copyediting and proofreading.
Attention to Detail: Meticulous attention to detail is crucial to catch even the subtlest errors and inconsistencies in spelling, punctuation, and formatting.
Critical Thinking: Professional copy editors and proofreaders possess the ability to critically evaluate the content, ensuring that it aligns with the intended purpose and audience.
Familiarity with Style Guides: Knowledge of and adherence to various style guides (e.g., APA, MLA, Chicago) is essential for maintaining consistency in language usage and formatting.
Mind the Graph platform revolutionizes the scientific research landscape by offering a dynamic toolkit designed to streamline and enhance the work of scientists. At its core, the platform facilitates significant time savings for researchers through its innovative use of templates. This not only accelerates the research process but also ensures a consistent and professional presentation of data. With Mind the Graph, scientists can transcend the traditional constraints of time-consuming graphic design, empowering them to focus more on the core of their research, ultimately fostering efficiency and productivity in the scientific community.
Grade Point Average (GPA) stands as a critical metric that profoundly influences every student’s academic journey. Whether you are a high school student seeking admission to prestigious colleges or a college student striving for excellence in your academic pursuits, understanding how GPA is calculated is a crucial skill. It goes beyond simple arithmetic, involving considerations of various grading scales, weighting methods, and conversions.
This article aims to be your comprehensive guide, providing an in-depth exploration and answering the key question “What is GPA after all?”, from its fundamental definition and calculation methods to its profound significance in both high school and college settings.
Grade Point Average (GPA) is a standardized numerical representation of a student’s overall academic performance. It is used in educational institutions to assess and compare the achievements of students with diverse academic backgrounds. GPA is calculated based on the grades obtained in various courses, providing a quantifiable measure of a student’s success in their studies.
In most cases, GPA is expressed on a scale of 0.0 to 4.0 in the United States, with 4.0 being the highest attainable GPA. However, grading scales can differ in other countries or educational systems. The GPA system allows colleges, universities, and employers to evaluate applicants and candidates more efficiently, as it condenses their academic performance into a single numerical score.
Also read: Applying to Grad School: A Complete and Explicative Guide
The calculation of GPA typically involves converting letter grades (e.g., A, B, C, D) or percentages into corresponding grade points (e.g., A = 4.0, B = 3.0, C = 2.0, D = 1.0), and then averaging these grade points across all courses taken within a specific time frame. The resulting GPA score serves as an essential factor in determining college admissions, eligibility for scholarships, academic honors, and various opportunities in the academic and professional realms.
Overall, GPA is a significant metric that reflects a student’s academic excellence, dedication, and consistency in their studies, making it a vital aspect of their educational journey and future prospects.
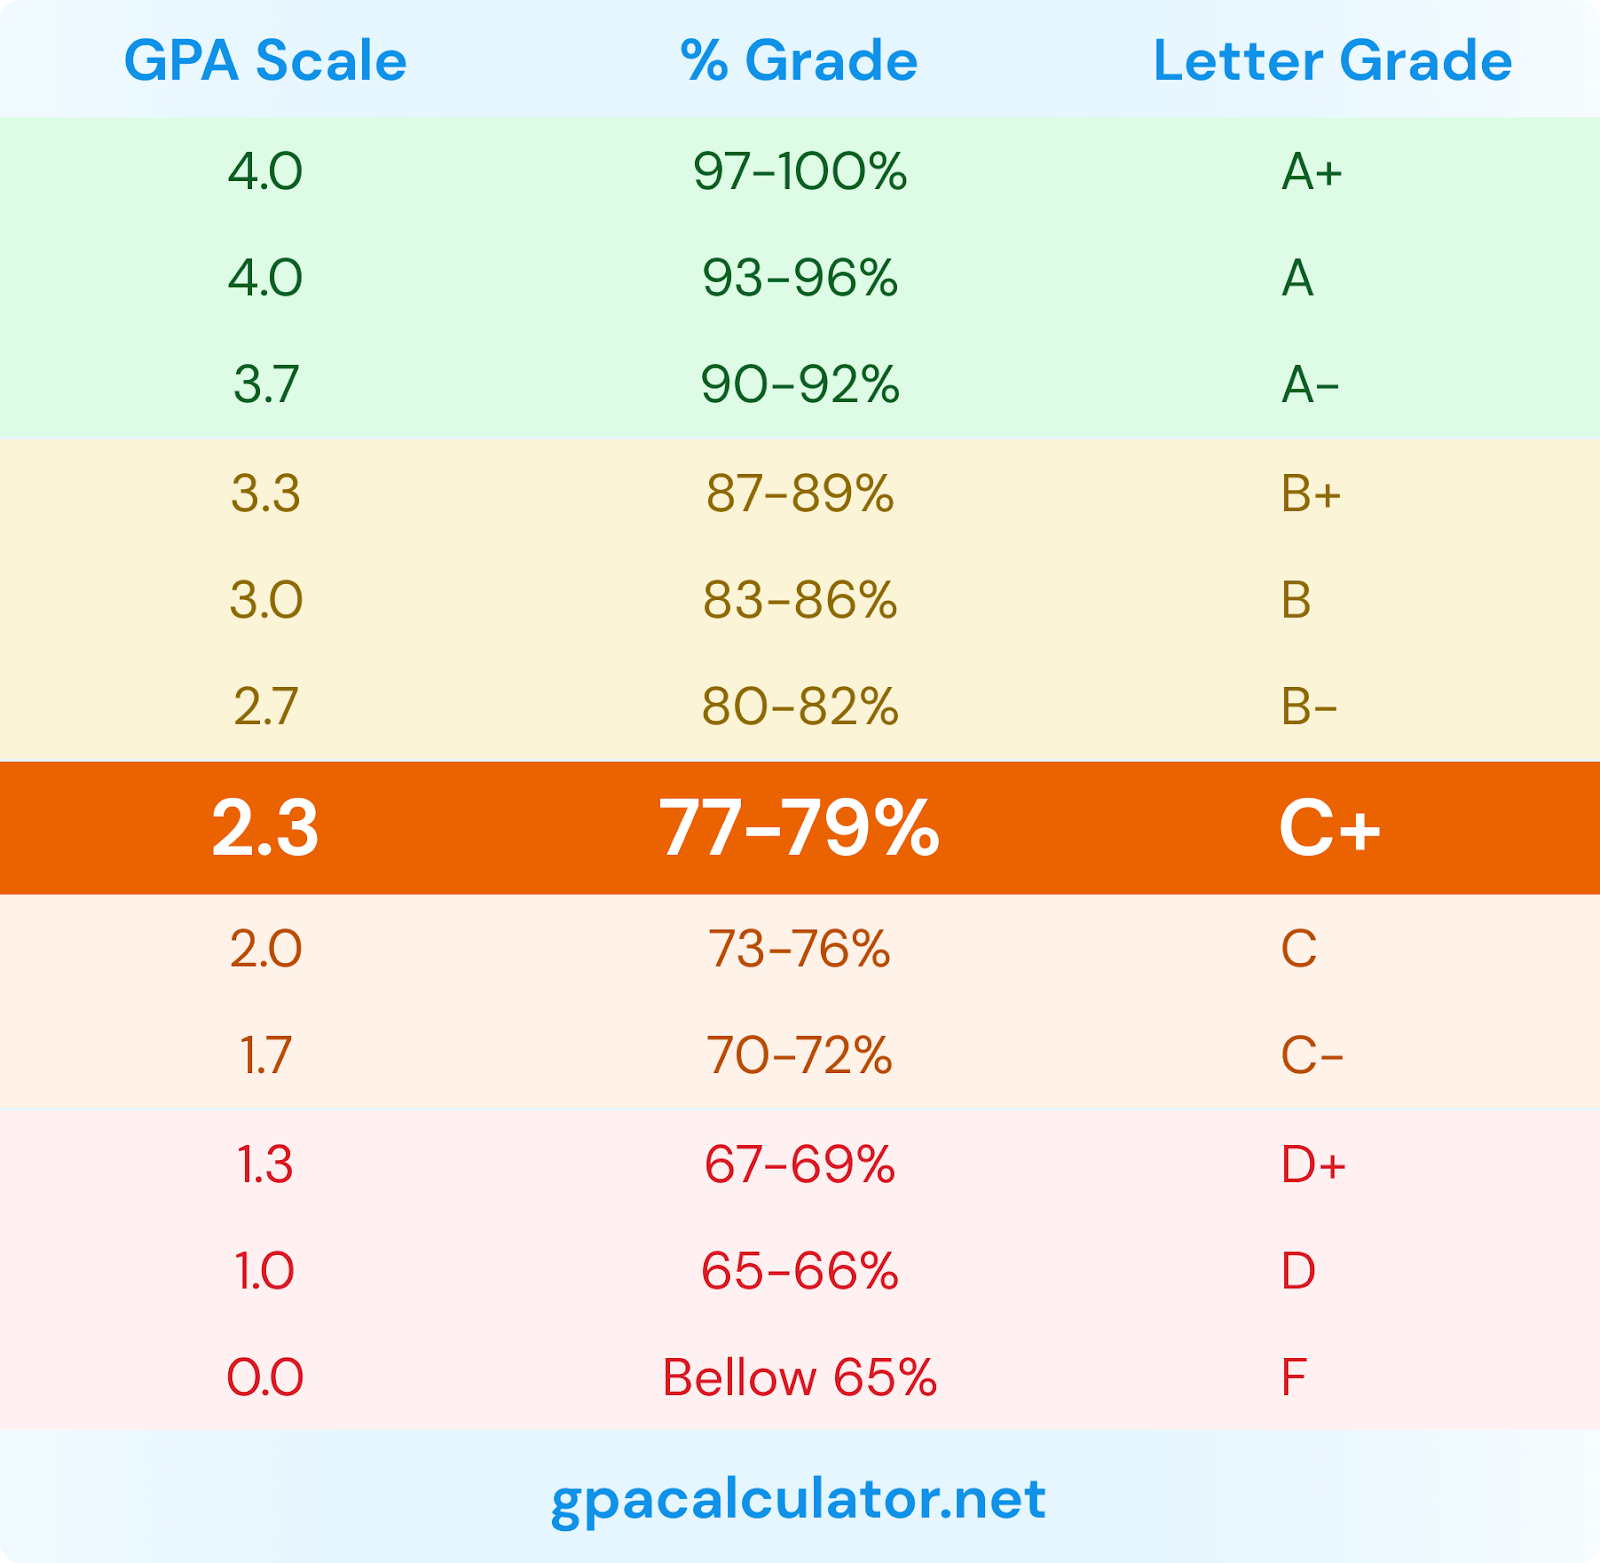
In the realm of education, a student’s High School Grade Point Average (GPA) holds profound importance. Serving as a vital measure of academic achievement, it plays a crucial role in college admissions, scholarship opportunities, and overall academic progress. Understanding High School GPAs and the factors that influence them can significantly impact a student’s educational trajectory and future prospects.
High School GPA is a numeric representation of a student’s cumulative academic performance during their high school years. It quantifies their grades across all courses, providing an average score that reflects their overall scholastic success. Typically, high school GPAs are calculated on a scale of 0.0 to 4.0, where 4.0 is the highest attainable GPA, indicating a perfect score.
High School GPAs are often computed using two primary scales: weighted and unweighted. The distinction lies in how certain courses are given extra weight, affecting the GPA calculation.
Grade Point Averages provide an insightful summary of a student’s academic accomplishments. By condensing multiple grades into a single numerical value, they offer a quick assessment of a student’s overall performance. A higher GPA suggests consistent excellence, while a lower GPA may indicate room for improvement.
Several factors influence a student’s High School GPA:
The average GPA can vary based on the educational institution and the student population. It can range from 2.5 to 3.5 in many high schools, with some exceptional cases exceeding 4.0 in schools that employ weighted GPAs.
Achieving a perfect GPA score of 4.0 requires consistent “A” grades in all courses throughout a student’s high school journey. This outstanding accomplishment reflects a student’s dedication and academic excellence, setting them apart in college applications and scholarship considerations.
As students transition to higher education, the significance of College Grade Point Averages (GPAs) takes on new dimensions. College GPAs serve as a critical indicator of academic performance during a student’s university journey. Understanding how College GPAs differ from High School GPAs and the various factors that influence their calculation is essential for students navigating the challenges and opportunities of the college experience.
College GPA, like its high school counterpart, is a numeric representation of a student’s academic achievements. However, in college, the GPA scale may differ from the traditional 4.0 scale. It typically ranges from 0.0 to 4.0 but can also include additional values such as 4.3 or 5.0, especially when considering weighted courses.
While both High School and College GPAs evaluate academic performance, several key differences set them apart:
Credit hours play a vital role in college GPA calculations. Each course is assigned a specific number of credit hours, which represents the amount of time spent in the class each week. Courses with more credit hours contribute more significantly to the overall GPA.
Average college GPA scores can vary widely depending on the institution, the academic programs, and the student population. While a “B” average (around 3.0) is often considered satisfactory, some competitive programs or colleges may have higher average GPAs due to rigorous academic standards.
Having addressed the question of “what is GPA,” let’s now delve into the calculation procedure. The process of calculating GPA follows a systematic approach that exhibits slight variations based on whether you are computing it for high school or college. Below, we outline the steps for calculating GPA in both contexts:
It’s essential to verify with your school or college to ensure you are employing the accurate method for GPA calculation, therefore, make sure to check if your institution uses a weighted GPA or if there are any specific adjustments to the calculation method.
Aside from GPA (Grade Point Average), there are various other grading systems used in education to assess and evaluate students’ academic performance. Some of these systems include:
These grading systems offer alternative ways to assess student learning and can provide more meaningful and personalized feedback to support academic growth and development. The choice of grading system may vary depending on the educational level, institution, and specific pedagogical approach.
Transform your scientific communication with Mind the Graph! Craft captivating infographics and visuals within minutes using our vast image library, templates, and an intuitive drag-and-drop interface. Impress your audience, save time, and elevate your research impact today! Join Mind the Graph now and unleash the power of visuals in your scientific journey.
We’ve all seen words like ‘ground-breaking’, ‘revolutionary’, and ‘life-changing’ being thrown around to describe various scientific publications. But how exactly do we measure the magnitude of measure impact of a scientific piece? That’s where the science impact factor comes in. Dive with me into this informative journey as we discuss, dissect, and delve deeper into understanding this essential instrument used in research assessment.
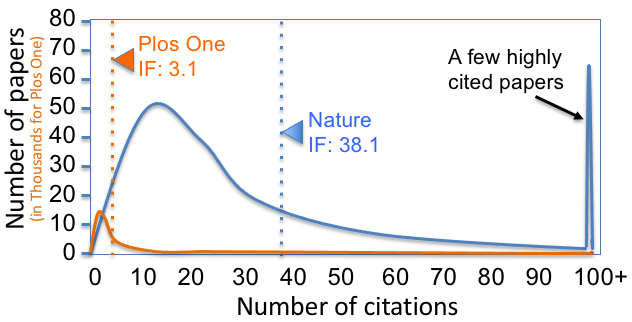
At its core, the Science Impact Factor (SIF) is a metric that indicates the average number of citations an article published in a specific journal receives within a certain timeframe. Originally introduced by Eugene Garfield at the Institute for Scientific Information (ISI), this measurement tool has slowly become embedded within academic spheres.
The idea behind SIF revolves around quantifying the influence or ‘impact’ of academic journals within their corresponding fields. Essentially, it is one way to rank these outlets based on their perceived relative importance, amongst peers.
The history of SIF harks back to 1963 when Dr Eugene Garfield conceived it merely as an aid for librarians to select which scholarly journals that should be included in library collections. However, its utility soon expanded beyond libraries.
In essence, researchers began using it as a measuring stick for the prestige linked with publishing in certain journals. As such, over time, it developed from being just another statistic into an emblem representing scientific authority.
Yet, despite its vital role today, remember that it was not originally intended for this purpose; hence some criticism does exist on using it as such – but more on that later!

Amongst peers in academic circles, having their work heavily cited is akin to winning discerning nods of approval – reinforcing the significance they command within their discipline. Consequently, higher science impact factor journals are often regarded as more authoritative owing to their larger citation count.
Moreover, SIF also influences career prospects for researchers. Promotions and grants often take into account individuals’ publication record, which includes the ranking of journals where their work appears. Consequently, SIF has become a crucial piece in the puzzle of academic recognition and progression.
However, while it holds visible importance, it’s not an impeccable measure. The ensuing parts will delve deeper into understanding how this tool calculates impact, its various uses, potential limitations, and future implications within the scientific community. So stay tuned!
Under this section, we delve into the precise mechanisms surrounding the computation of the science impact factor. Also, we unravel what considerations come into play during its calculation and how a journal’s impact factor is ultimately determined.
The science impact factor is determined by an undeniably simple yet extremely potent mathematical formula — devised many decades ago to measure a journal’s influence in academic circles. In essence, it represents the average citation rate that the articles published in a journal receive within their first two years.
Here is how it works: The total number of citations received by all items (mainly research papers) published in a specific scientific journal during the preceding two years is divided by the total count of said items produced within that particular year during that timeframe. This gives us the annual science impact factor.
For example, if Journal Z had 100 articles last year and they were cited 200 times this year, then its annual impact factor would be 200/100, which equals 2.0.
Simply put:
Science Impact Factor = (Citations received in Year X)/(Articles published in Year X-1 or X-2)
While calculating the science impact factor may seem fairly straightforward, several factors at play need to be taken into account:
All these factors combine to form a nuanced understanding of how much real “impact” a journal has in its field.
The evaluation procedure is steadfastly helmed by Clarivate Analytics, the organization currently responsible for computing and distributing annual science impact factors.
The process gleans data from thousands of academic and medical journals alone, which calls for stringent standardization practices to ensure credibility and consistency. These include:
Apart from garnering commendation as an intuitive method to gauge journal prestige, this system also assists bibliometricians and researchers in comparing journal citation reports and patterns across disciplines, fuelling smarter publishing decisions while fostering enhanced clarity in academia.
As we delve deeper into the topic, it’s crucial to understand the various purposes associated with the science impact factor. Its significance spans from journal assessment, through dictating academic publishing decisions, and even affects funding considerations by agencies. The appreciable influence of journal impact factor doesn’t stop there; it also plays a critical role in delineating career trajectories for researchers.
In the realm of scientific journals, quality trumps fame by one to zero. And here is where the term ‘science impact factor’ displays its paramount import. This value serves as an indicator reflecting how often papers from a specific journal get cited within science magazines their first two years post-publication. Essentially, higher impact factors denote a more influential role that these journals play within their respective scientific discipline.
A study published in PLoS ONE corroborates the aforementioned points, elucidating that the most prestigious scientific journals manifest higher journal impact factors[^1^]. These insights effectively validate that when it comes to assessing journal quality, ‘higher science impact factor equals better’.
The domino effect propagates further onto influencing decisions pertaining to research publication venues. Since more citations tend to signify higher utility and greater recognition amongst peers[^2^], authors often opt for publications revealing optimum science impact factors.
How does this occur? By inducing grab-and-hold interest in researchers eyeing a desirable boost in their citation count down the line: an essential aspect for accelerating academic progression and reputation.
Notable granting agencies utilize various metrics to drive their decision-making processes towards propitious ventures only — and indeed, you guessed it right! One such metric happens to be none other than our focal point: the science impact factor.
Why so? Several studies have revealed some correlation between high-impact factor journals and articles of superior quality or value[^3^]. Consequently, these funding institutions have been known to veer towards researchers whose work is frequently cited by peer reviewers, i.e., published in high-impact factor journals.
Related article: Proven Grant Writing Tips: Boost Your Funding Success
The benefits reaped from superior science impact factors influence the career advancement opportunities available for researchers too. Not only does publishing in high-impact journals act as a catalyst for their scientific reputation, but it also enhances possibilities of employment within prestigious research institutions[^4^].
Everry incremental step up the ladder can make all the difference between securing tenure at a top university or fading into academic obscurity. Indeed, it’s an intense competition out there in the scholarly world, and having your research highlighted by virtue of a higher citation count can echo loudly across academia — courtesy of remarkable science impact factors!
[^1^]: PLoS ONE: Prestige versus Impact [^2^]: Journal of Informetrics: Does quantity lead to more citations? [^3^]: BMC Medical Research Methodology: Impact factor correlations with article quality [^4^]: Nature Careers: Publish-or-perish pressure steers young researchers away from innovative projects
The science impact factor, while designed to assess the quality and relevance of a scientific journal, is often misapplied at the individual article or researcher level. Critics argue that it fails to accurately mirror an individual’s research impact due to several reasons:
Therefore, evaluating a scientist’s work based on a journal’s impact factor can lead to misrepresented importance or neglect of significant research.
Interestingly, the value of a science impact factor itself varies across disciplines, causing another layer of bias. Let me explain why:
These differences make cross-discipline comparison using just the science impact factor nearly impractical.
Critics also contest whether there exists any direct relationship between science impact factor and research quality. This question arises due to:
Both factors inflate citation rates and hence enhance the science impact factor without improving actual research quality.
Lastly, certain editorial policies also influence a journal’s science impact factor which calls its objectivity into further question:
Such calculated deviations can distort the actual value, making it a less reliable tool for judging the intrinsic worth of published studies.
In light of these criticisms, I’d urge readers not to regard science impact factors as an absolute indicator. It’s crucial to recognize their limitations and use them in conjunction with other tools when assessing research contributions. We need a more holistic approach that incorporates aspects like systematic reviews, qualitative assessments, societal impacts and altmetrics measurements.
As we navigate this complex debate around science impact factors remember – the emphasis should always remain on encouraging high-quality, ethical research irrespective of metrics. That is indeed the soul of scientific advancement!
While the science impact factor has been a prominent tool to assess scientific impact, it is not the only one. Several others have surfaced in recent years to provide more nuanced and comprehensive evaluations.
One widely accepted alternative is the h-index, developed by Jorge Hirsch. The h-index measures an author’s productivity and citation impact compared to journals. Scholars with an h-index of ‘n’ have published ‘n’ papers with at least ‘n’ citations each. This metric sidesteps some limitations of the science impact factor as it accounts for both the quantity and quality of work produced by a researcher over time.
Another approach gaining ground is altmetrics – short for alternative metrics. This system goes beyond traditional citation-based metrics, capturing online engagement with research outputs across various digital platforms such as reference managers, social media networks, news outlets, blogs, and policy documents.
Furthermore, the Eigenfactor® Score considers a journal’s overall scientific significance based on its total influence rather than only considering the average number of citations per article like in the Science Impact Factor.
As Einstein once said: “Not everything that can be counted counts, and not everything that counts can be counted.” These alternatives to science impact factor each offer their strengths but also invite shortcomings.
The strength of the h-index lies in its capacity to gauge an individual scientist’s lasting contribution rather than temporary popularity. However, it cannot differentiate between active or dormant scientists if both have similar publication history.
Altmetrics takes advantage of modern data sources for a broader evaluation scope, reflecting immediate societal impacts often excluded from traditional metrics. Its weakness resides in its susceptibility to manipulation; plus these social engagement indicators may not necessarily reflect scholarly importance.
Eigenfactor®, through its nature-dependent scoring models, offers insight into journal prestige and the multi-dimensional influence of scientific publications bringing multidiscipline and size neutrality. Nevertheless, despite such sophisticated models, Eigenfactor® remains vulnerable to self-citation practices.
Therefore, no single measure is universally valid or foolproof. Each complements others by considering aspects overlooked in other models, representing a mosaic of insights into the multifaceted nature of scientific impact. A diverse metric toolkit can provide a more comprehensive picture than any single index serving as a reminder that good science transcends numbers.
Amid growing criticism surrounding the reliability and impartiality of science impact factor, remarkable strides have been made by various institutions and organizations in identifying its limitations. For instance, the research community has seen increased endeavours into disserting whether this rating truly mirrors a journal’s prestige or simply casts an illusion.
To put it simply, there is a unanimous acknowledgement that placing excessive reliance on science impact factors might compromise scientific ingenuity and quality. It needs special mention here, the pioneering San Francisco Declaration on Research Assessment (DORA) which called for a more holistic evaluation methodology inclusive of factors beyond citation count alone.
Additionally, institutions like The Wellcome Trust and UK Research & Innovation (UKRI) are spearheading reforms to combat these flaws. Their objectives include fostering responsible use of metrics in funding decisions and encouraging ethical practices amongst researchers aiming for higher impact factors.
The critique around the science impact factor catalysed audacious changes in research evaluation systems across global scientific domains. There is an increasing trend towards adopting multi-dimensional methodologies that intend to encapsulate a comprehensive view of research efficacy beyond just bibliometric measures.
Semantic Scholar’s AI Score is one such method that uses machine-learning algorithms to gauge a paper’s impact while considering several key elements such as novelty, presentation clarity, scientific soundness, etc.
Another compelling alternative comes from Publish or Perish software which accords equal importance to both heavily cited papers and those with fewer citations but impactful content nonetheless. This alleviates unfair biases ingrained in traditional methods.
Moreover, organisations are moving towards close scrutiny on merits besides public engagement; academic mentoring; policy shaping along with the applicant’s actionable plan to foster inclusivity in science through outreach programs augmenting their publication track record signifying their commitment to enhance future scientific progress.
As science impact factor continues to spark debates, more comprehensive and equitable systems like these are a step in the right direction. This novel trend catalysed improvements ensuring science progression hinges on well-rounded assessments rather than being confined by singular metrics. These endeavours, thus, pave an innovative path for scientific research’s future.
An important aspect of the scientific milieu, and one that cannot be stressed enough, involves ensuring ethical practices while dealing with the science impact factor. This critical metric comes with its set of challenges which includes issues surrounding gaming the system for better factors, publication bias affecting calculations, and difficulties in maintaining transparency as well as fairness in the assessment process.
The pressure to publish high-impact research can sometimes shadow good scientific conduct. Unfortunately, this has given rise to some unscrupulous practices aimed at artificially inflating a journal average article’s impact factor.
One such illicit practice is “citation stacking,” where multiple authors agree to cite each other’s work in an effort to increase their collective impact factors. Similarly, editors may encourage or even insist on citing articles from their own journals—a tactic known as “self-citation” —to inflate the numbers.
While these actions may initially boost a journal’s ranking or an author’s reputation, they ultimately undermine the integrity of both scholarly publishing and science—leading us further away from genuine attempts at advancing knowledge.
Publication bias refers to the trend of researchers and editors favoring results showing clear-cut significant findings over studies with negative or vague results.
When only ‘positive’ outcomes are published, it leads to skewed data representation in journals, significantly impacting their perceived relevance—a direct influence on their Science Impact Factors. This also portrays an unrealistic image of scientific inquiry where all trials yield major breakthroughs which is quite far from reality. By neglecting the null-filled landscapes we journey through before hitting goldmines; we create a misconceived narrative around what constitutes progressive science.
This systematic suppression limits reproducibility attempts—an essential component for validating scientific findings—and more importantly casts shadows on future research paths.
Also read: Publication Bias: All You Need To Know
Transparency and fairness are foundational ideals that perhaps each scientific endeavor should strive for. However, when it comes to assessment procedures grounding science impact factors, achieving those becomes a prickly task.
A prime challenge is in achieving a fair distribution of citations. Not all research fields advance at the same pace or have equal audience sizes—some areas witness rapid strides and numerous publications while others may be more specialized with fewer but nonetheless important advancements.
Existing metrics do little to account for these disparities which could marginalize certain fields, despite their utility and importance. While some improvements over time have been observed, changing methods mid-stream can unfortunately breed its own form of bias; it’s like comparing apples with oranges.
Another concern is the Science Impact Factor being used as a standalone quantitative measure without considering other qualitative factors contributing towards overall research credibility and relevance—a slippery slope towards reductionist tendencies cheapening actual merit behind works.
Facing such challenges mandates exploring balanced solutions like blending new comprehensive metrics with traditional ones ensuring we truly value what matters—potent research aiding societal progress.
As often happens in the dynamic scientific landscape, the science impact factor is experiencing changes and adaptations resulting from continuous advancements in research methodologies and publication practices.
Traditionally, the impact factor has played a prominent role in bibliometrics – the field dedicated to analyzing published material. It came into being with print publications at its heart. However, seeing as how we now live squarely within a digitized age, it has become necessary to adjust this tool to better capture the changing tides.
With newer disciplines like data science and computational biology emerging, there’s been an increasing intersectionality of fields which doesn’t lend itself well to traditional subject category assignment within databases that calculate impact factors. This sparked various initiatives to make adjustments for these new areas of study, thereby broadening the scope of what’s considered when calculating impact factors. Coupled with ever-evolving digital tools available for analysis, this trend only signifies our constant strive towards refining accuracy.
Following closely behind these changes are alterations brought upon by open access (OA) publishing – another giant leap forward for democratizing knowledge dissemination.
Also read: What Is Open Science and Why is it Important in Research
When OA journals first entered scholarly communication systems, there were debates regarding their quality due to numerous factors like ‘pay-to-publish’ models etc. However, over time many have shown significant growth in their science impact factor ratings – rewarding those producing high-quality research without hidden paywalls.
The rise of OA publications led us further to question exclusive reliance on impact factors while determining a journal’s worth or an article’s influence. Many argue that simply exploring raw citation counts dispensed by search sites like Google Scholar could serve a similar purpose more transparently.
Lastly, looking ahead prompts discussions around leveraging artificial intelligence (AI) and machine learning (ML). By employing such technologies, we could potentially automate the process of identifying influential papers more comprehensively than just raw citation counts – therefore rendering a much fairer reflection on research quality.
Moreover, ideas around developing ‘context-dependent impact factors’ have taken shape to counter biases in overall results. For instance, considering ‘field-weighted’ metrics might help iron out inherent discrepancies arising from varying public interest levels across different fields.
Thus, despite the ongoing debates surrounding the science impact factor, it remains an essential tool serving as an indicator of scientific relevance. Yet its future lies in embracing these upcoming advancements for refining its analytical power and perhaps even redefining what ‘impact’ means within the academic community.
Throughout this comprehensive analysis, we’ve dived deep into the world of impact factors in science. Let’s recall a few salient points that were thoroughly elucidated through citation analysis. First and foremost, we unpacked what the science impact factor signifies and its historical development. Furthermore, we shed light on how it’s calculated and evaluated.
Getting further into the substance of our essay, we examined multiple high-stakes usage scenarios for science impact factor rankings — from making publishing decisions to influencing resource allocation by grant agencies. Additionally, we acknowledged that while the science impact factor is a significant metric within scientific circles, it does encounter criticism and has its recognized limitations.
Interestingly enough, there are alternative models to assess scientific contributions; each offering unique strengths and weaknesses compared to the traditional science impact factor model. Engaging with these criticisms and alternatives pushed institutions towards adopting comprehensive evaluation systems better suited for assessing research value overall.
Lastly, ethical considerations tied to utilizing such metrics came under our spotlight. With all perks and privileges come incumbent risks of misuse or gaming the system. In turn, this results in publication bias affecting final scores – pointing again at potential limitations inherent in even commonly respected metrics like science impact factor.
As we gaze into the future of scholarly research evaluation methodologies like Science Impact Factor (SIF), one thing is certain – change is inevitable. Despite its occasional critique, SIF still forms an integral part of academic appraisal frameworks across several disciplines globally.
However, it’s clear that modern trends are compelling us towards embracing more holistic approaches for judging scientific contributions beyond just citation count or journal prestige. This transformation won’t happen overnight but will require sustained efforts from academicians, publishers and granting bodies alike.
The rise of open-access publishing significantly challenges traditional modes of knowledge dissemination – pushing us to redefine success benchmarks including those associated with science impact factor. Herein, we may find opportunities for potential advancement in measuring and evaluating scientific journal impact factors.
Finally, burgeoning advancements in big data analytics and machine learning propose revisiting how we assess scholarly worth – potentially heralding a new era of research evaluation that’s decidedly more nuanced and insightful. Only time will tell what fruit these seeds of change will bear.
But until then, the incumbent system, while flawed, with the science impact factor at its core, remains our best bet at quantifying academic merit – guiding resource allocation decisions in our collective pursuit of knowledge enhancement. Rest assured knowing the ongoing dialogue within academia is ceaselessly pushing us towards an improved schema truly reflective of a researcher’s contribution to their field.
Did you realize that elevating your papers’ impact and visibility is achievable through top-notch infographics? It’s true! With the innovative Mind the Graph infographic tool, you can unlock a whole new level of engagement for your research work. Seamlessly integrate captivating visuals that not only amplify the presentation of your paper but also extend its reach to wider audiences. Ready to revolutionize your academic communication? Don’t miss out – sign up today to harness the full potential of this game-changing tool!
A study developed after a talk between two scientists in 1977 stirred the whole perception of “Motivation”. Developed by Richard Ryan and Edward Deci, a theory called “Self Determination Theory (SDT)” is a milestone in understanding why humans do what they want to do. I bet you want to know the logical reasoning and science behind high enthusiasm for some tasks and not feeling so motivated for the rest!
Self-determination theory opened the door to numerous exploratory psychological experiments. It helped scientists understand the obviousness of motivation of a two-year-old child to play and not requiring motivation to do so as opposed to some tasks at the office when we don’t feel connected! (e.g. clerical tasks for a researcher vs running gel electrophoresis after a PCR experiment). Self-determination theory, if understood correctly, can help professionals like, teachers, professors, scientists and from a family perspective parents to help create motivated environments for students, employees and kids and improve learning outcomes and wellness.
Have you ever struggled to find words for what motivated you to perform well in a presentation/project/competition etc.? We sometimes share that we are less motivated or highly motivated for a certain task and we don’t know what motivation is. Sharing a simple explanation, motivation is Energy for Action. Motivation can not be quantified in terms of any unit like kg or km or pascal or joules but if you think enough you will agree that motivation is the psychological energy that drives action. Self-determination theory allows us to dive deeper into the concept and describes the type of motivation and science behind feeling “Amotivated ”.
The core component of the self-determination theory is the distinction between the Extrinsic and Intrinsic motivation types. The theory revolves around the type of motivation and its outcomes. Extrinsic motivation is also called controlled motivation. Let’s dive deeper and understand them better.
Extrinsic motivation refers to the pursuit of goals or engagement in activities primarily driven by external rewards or consequences, rather than inherent enjoyment or satisfaction derived from the task itself. Individuals motivated extrinsically may engage in activities to obtain tangible rewards such as money, praise, or social approval, or to avoid punishment or negative outcomes.
For instance, a student might study diligently for an upcoming exam not because they find the subject matter inherently interesting or enjoyable, but rather to earn a high grade and receive praise from their parents or teachers. In extrinsically motivated behaviour, the focus lies on the external outcome or incentive rather than the inherent enjoyment or satisfaction derived from the activity.
Or in a workplace scenario, Imagine an employee working overtime on a project not because they find the work particularly engaging or meaningful, but because they want to earn additional money through overtime pay. Despite feeling tired or unenthusiastic about the task, the employee is motivated to put in extra hours solely for the external reward of increased financial compensation. In this scenario, the extrinsic motivation driving the employee’s behavior is the desire to earn more money, rather than any intrinsic enjoyment or fulfillment derived from the work itself.
Intrinsic motivation involves engaging in activities or pursuing goals for the inherent satisfaction, enjoyment, or personal fulfillment they provide, rather than for external rewards or pressures. Individuals intrinsically motivated are driven by a genuine interest in the activity itself, finding it inherently enjoyable, challenging, or personally meaningful. For example, a person who loves playing the piano may spend hours practicing purely for the joy of creating music and the personal sense of accomplishment it brings, without any external pressure or expectation of rewards.
Intrinsic motivation is characterized by a sense of autonomy, competence, and relatedness, as individuals feel a sense of ownership and control over their actions, perceive themselves as capable of mastering the task, and may experience a deep sense of connection or engagement with the activity or goal.
Consider a scientist who is deeply passionate about understanding the complexities of climate change. Driven by a genuine curiosity and desire to contribute to the collective understanding of this critical issue, the scientist devotes countless hours to conducting research, analyzing data, and formulating hypotheses. Despite the challenges and uncertainties inherent in scientific inquiry, the researcher finds intrinsic satisfaction and fulfillment in the process of discovery itself. The joy of unraveling new insights, uncovering patterns, and advancing knowledge in their field serves as a powerful intrinsic motivator, fueling the scientist’s commitment and perseverance in their research endeavors. In this case, the researcher’s intrinsic motivation arises from their inherent interest and passion for the subject matter, rather than external rewards or pressures.
Within the framework of Self-Determination Theory (SDT), autonomy, competence, and relatedness are three fundamental psychological needs that are essential for fostering intrinsic motivation, well-being, and optimal functioning.
Autonomy refers to the sense of volition, choice, and self-endorsement in one’s actions. It involves feeling that one’s behavior is self-directed and aligned with one’s own values, interests, and goals, rather than being controlled by external pressures or demands. In the context of SDT, autonomy-supportive environments promote individuals’ sense of autonomy by providing opportunities for self-expression, decision-making, and independent problem-solving. When individuals feel autonomous, they experience a greater sense of ownership and engagement in their activities, leading to enhanced motivation, satisfaction, and well-being.
Competence refers to the sense of effectiveness, mastery, and capability in one’s interactions with the environment. It involves feeling confident in one’s ability to successfully navigate challenges, learn new skills, and accomplish tasks. Within SDT, competence-supportive environments provide opportunities for individuals to develop and demonstrate their abilities, receive constructive feedback, and experience a sense of progress and growth. When individuals perceive themselves as competent, they are more likely to feel motivated, confident, and intrinsically satisfied in their pursuits, leading to greater persistence and achievement.
Relatedness refers to the sense of connection, belonging, and interpersonal involvement with others. It involves feeling understood, cared for, and valued within social relationships and communities. In the context of SDT, relatedness-supportive environments foster positive social interactions, empathy, and mutual respect, promoting individuals’ sense of connection and belongingness. When individuals experience a sense of relatedness, they are more likely to feel motivated, supported, and emotionally fulfilled, leading to enhanced well-being and flourishing.
Beyond Deci and Ryan, several other scientists have contributed significantly to the development and expansion of Self-Determination Theory (SDT). Some prominent researchers include:
These researchers, among others, have furthered our understanding of SDT, expanding its application across various disciplines and refining its theoretical constructs through empirical research and practical applications.
In education, SDT principles can be applied to design learning environments that promote students’ autonomy, competence, and relatedness, thereby enhancing their motivation and academic achievement. For example, teachers can foster autonomy by providing students with choices and opportunities for self-directed learning, such as allowing them to select topics for projects or offering various learning pathways to accommodate different learning styles. By supporting competence, teachers can provide constructive feedback, scaffolding, and challenging tasks that match students’ skill levels, helping them develop a sense of mastery and confidence in their abilities. Additionally, fostering relatedness involves creating a supportive classroom climate characterized by positive teacher-student relationships, peer collaboration, and a sense of belongingness. For instance, group projects that encourage collaboration and social interaction can promote students’ sense of connectedness and engagement in learning.
Similarly, in the workplace, SDT principles can be applied to cultivate a motivational environment that enhances employees’ job satisfaction, performance, and well-being. Organizations can support autonomy by providing employees with autonomy in decision-making, task allocation, and work schedules, empowering them to take ownership of their work and align it with their personal values and goals. Supporting competence involves offering training, resources, and opportunities for skill development and growth, enabling employees to acquire new skills, overcome challenges, and achieve meaningful progress in their careers. Moreover, fostering relatedness entails promoting a positive work culture characterized by supportive relationships, open communication, and a sense of belongingness among colleagues. For example, team-building activities, mentoring programs, and recognition initiatives can foster a sense of camaraderie and mutual support, enhancing employees’ engagement and commitment to their work.
You can read in-depth the research: “The History of Self-Determination Theory in Psychology and Management“.
While Self-Determination Theory (SDT) has been influential in understanding human motivation and behavior, it also has some limitations that warrant consideration:
SDT was primarily developed in Western cultural contexts, which may limit its generalizability to diverse cultural settings. The theory’s emphasis on individual autonomy and independence may not fully capture the cultural nuances and variations in motivation across different cultural backgrounds. Thus, SDT’s applicability and relevance in non-Western cultures may be limited, necessitating caution in its interpretation and application in diverse cultural contexts.
SDT focuses on intrinsic and extrinsic motivation as distinct constructs, but in reality, motivation is often multifaceted and complex. Individuals may experience a blend of intrinsic and extrinsic motives that interact in dynamic ways, making it challenging to categorize motivations into discrete categories. Additionally, SDT may overlook other important factors influencing motivation, such as personality traits, social norms, and situational factors, which can also play a significant role in shaping behavior.
Assessing the constructs of autonomy, competence, and relatedness can be challenging, particularly in terms of developing reliable and valid measures. While various scales exist to measure these constructs, they may not fully capture the intricacies of individuals’ experiences or the context-specific nature of motivation. Moreover, self-report measures used in SDT research may be susceptible to biases and social desirability effects, potentially impacting the validity of findings.
While autonomy is a central tenet of SDT, an excessive focus on autonomy may overlook the importance of other psychological needs and social influences in shaping motivation and behavior. For example, the theory may underestimate the role of social relationships and belongingness in motivating individuals, particularly in collectivist cultures where social connections are highly valued.
While SDT provides a valuable theoretical framework for understanding motivation, it may offer limited practical guidance on how to effectively apply its principles in real-world settings. Translating SDT into actionable strategies for promoting motivation in education, healthcare, or workplace contexts may require additional research and practical insights to address specific challenges and contexts.
We have motivation in every click with Mind the Graph. Our platform gives you the ability to create charts, infographics, posters and graphical abstracts using icons of your choice. Choose from thousands of Icons and find your relatedness to your research topics. We are sure that when you can communicate your research better to your audience it shall bring a sense of competence in you. Please feel free to connect to us and use the platform for your first creation and gain your wellness.
We invite you to embark on an adventure where precision and excellence come together to redefine the landscape of scholarly success. In the complex world of research, impact is not just determined by discovery but also by presentation. Throughout this blog, we will explore the transformative power of expert scientific editing, where every word helps you refine your research’s canvas. Our goal is to train you to be a skilled craftsman of clarity, an architect of precision. Learn how to elevate your research impact by unravelling the nuances that set the ordinary apart from the extraordinary. Ensure unparalleled success in your scholarly journey by relying on the power of precision.
In scientific editing, written content is refined and enhanced to ensure clarity, coherence, and precision. Rather than just proofreading, it looks at the substance and structure of the manuscript. Grammar, syntax, and language usage are scrutinized by expert scientific editors to elevate the overall quality of the research. A seamless narrative that captures the reader is also ensured by their attention to logical flow.
Along with linguistic refinement, scientific editing examines the content’s scientific merit, coherence, and compliance with publication standards. Researchers and editors work together to refine their work, providing insights into how to improve its impact and accessibility. In the end, scientific editing involves transforming raw research findings into polished narratives that can have a broader impact within the academic community and beyond.
Editing scholarly work goes beyond mere proofreading, aiming to improve its clarity, quality, and impact. Taking into account language, structure, and coherence, the journey begins with a comprehensive review of the manuscript.
1. Assessment and Planning: Review the manuscript thoroughly, identifying areas for improvement in language, structure, and content. Identify the editing process and develop a plan.
2. Linguistic Precision: Refine the language of the manuscript. Improve the clarity of complex scientific concepts by correcting grammar, syntax, and enhancing clarity.
3. Structural Enhancement: Analyze the flow of ideas and how they are organized. Ensure smooth argument progression and adherence to citation styles by rearranging the structure for logical coherence.
4. Content Refinement: Make sure that data, methodology, and results are accurate, consistent, and reliable. Tables and figures should be polished to contribute meaningfully to the narrative and overall impact.
5. Collaboration, Review, and Finalization: Communicate collaboratively with the author, answering questions and making suggestions. Ensure all elements align harmoniously by conducting a holistic review. Make sure the manuscript is precise and scholarly impactful by providing feedback, iterating as needed, and finalizing it.
The benefits of scientific editing extend beyond mere error correction, enhancing the quality and impact of research. To begin with, linguistic refinement enhances the manuscript’s clarity, making complex scientific concepts accessible to a broader audience. It not only enhances the readability of the work, but also elevates its professionalism.
The narrative becomes more coherent and logical with structural improvements. The editing process ensures a clear and compelling flow of ideas. Furthermore, engaging and persuasive research is aided by this method. The key benefits would be:
By digging deeper into the content, scientific editing goes beyond the surface. Data, methodology, and results are meticulously analyzed by editors, ensuring accuracy and consistency. Research is strengthened by this scrutiny. A collaborative editing process also encourages valuable exchanges between editors and authors. Interactions like these not only clarify uncertainties but also ensure the editor’s enhancements match the author’s intent, preserving his/her unique voice.
In the end, scientific editing benefits the entire scholarly community. The polishing of a manuscript ensures that it will not only be published quickly, but will also influence peers and contribute to the advancement of knowledge in its respective field.
The types of scientific editing available cater to different aspects of manuscript improvement, offering a range of services tailored to authors’ specific needs. The following are some types of scientific editing:
Corrections are made to grammar, syntax, punctuation, and style. In addition to ensuring that the language is clear and consistent, it ensures that the chosen style guide is adhered to.
Analyzes the manuscript in more detail, addressing issues such as structure, organization, and flow of content. The aim is to make the narrative more coherent and clear.
Examines the manuscript’s substance, including the accuracy of the data, methodology, and results. A rigorous, logical, and aligned editorial process ensures that the content adheres to the research objectives.
Verify grammar, spelling, and formatting for any errors. In order to catch any remaining issues before publication, proofreading is typically done after substantial editing.
A customized solution to meet the specific requirements of a journal. The purpose of this type of editing is to ensure that the manuscript complies with the journal’s formatting, citation style, and other editorial requirements.
This service is specialized for authors who do not speak English as their first language. While retaining the author’s intended meaning, it improves the manuscript’s coherence and fluency.
Usually applied to technical or scientific documents, this type of editing ensures that technical terms, jargon, and complex concepts are accurate and clear. The accuracy of scientific communication depends on it.
Focuses on maintaining consistency and adhering to specific writing styles. By doing so, formatting, citations, and other stylistic elements are uniform throughout the document.
It entails properly formatting headings, subheadings, citations, and tables, as well as placing them in an appropriate format.
Ensures that references are accurate and complete. All citations are checked by editors to ensure that they are correct, properly formatted, and lead to the correct sources.
Related article: Citation vs Referencing: Understanding the Key Differences
In order to ensure the quality and effectiveness of your manuscript, you must choose the right editing service. Consider these key factors when choosing:
Make sure the editing service has experience editing your specific academic or scientific field. Those who are knowledgeable about your subject matter can offer insights and improvements that align with your discipline’s conventions and nuances.
Make sure the editors associated with the service are qualified and experienced. Ideally, you should seek out individuals with advanced degrees, research experience, and a history of editing academic publications successfully. The effectiveness of the editing process can be significantly enhanced by a qualified editor.
Your manuscript should be edited by a service that offers a variety of editing options. Make sure the service aligns with your manuscript’s needs, whether it is proofreading or substantive content editing.
Ensure that the pricing and turnaround times of your editing service are transparent. An efficient editing timeline and clarity on costs are essential. By doing this, you ensure that the service is not only in line with your budget but also with the submission deadline for your manuscript.
Make sure your editing service values effective communication and collaboration. In order to ensure a collaborative editing process, a service must engage you in open dialogue, clarify your research, and understand your objectives. The communication-centric approach contributes to the creation of an authentically reflective final manuscript.
In conclusion, we have explored precision, collaboration, and excellence in the world of scientific editing. Each step contributes to elevating the research impact, from linguistic finesse to structural coherence. The artistry of editing goes far beyond correction—it’s a collaborative process dedicated to refining and amplifying a researcher’s voice. We have uncovered the diverse types of scientific editing services and factors to consider in choosing the right one.
Well-edited manuscripts are a powerful testament to a dedication to quality in the ever-evolving world of academia, where ideas are currency. With the insights from this exploration, you can use scientific editing to create a lasting impact on your research as you embark on your scholarly endeavors.
Let your scientific endeavors be performed with precision, and may your manuscripts be edited with the clarity and professionalism they truly deserve. Whether you are a seasoned researcher or an aspiring academic, scientific editing can help you craft narratives that are timeless. Happy writing!
Streamline the complexity of research and dissertations with this game-changer in academia. Using Mind the Graph‘s powerful tools, you can seamlessly integrate visuals into your drafts, enhancing clarity and opening the door to increased citations. You can make your research more accessible and impactful by engaging your audience visually. Mind the Graph empowers your work with compelling infographics that will enhance your scientific communication. Visit our website for more information.

Unlock Your Creativity
Create infographics, presentations and other scientifically-accurate designs without hassle — absolutely free for 7 days!
Try it for free


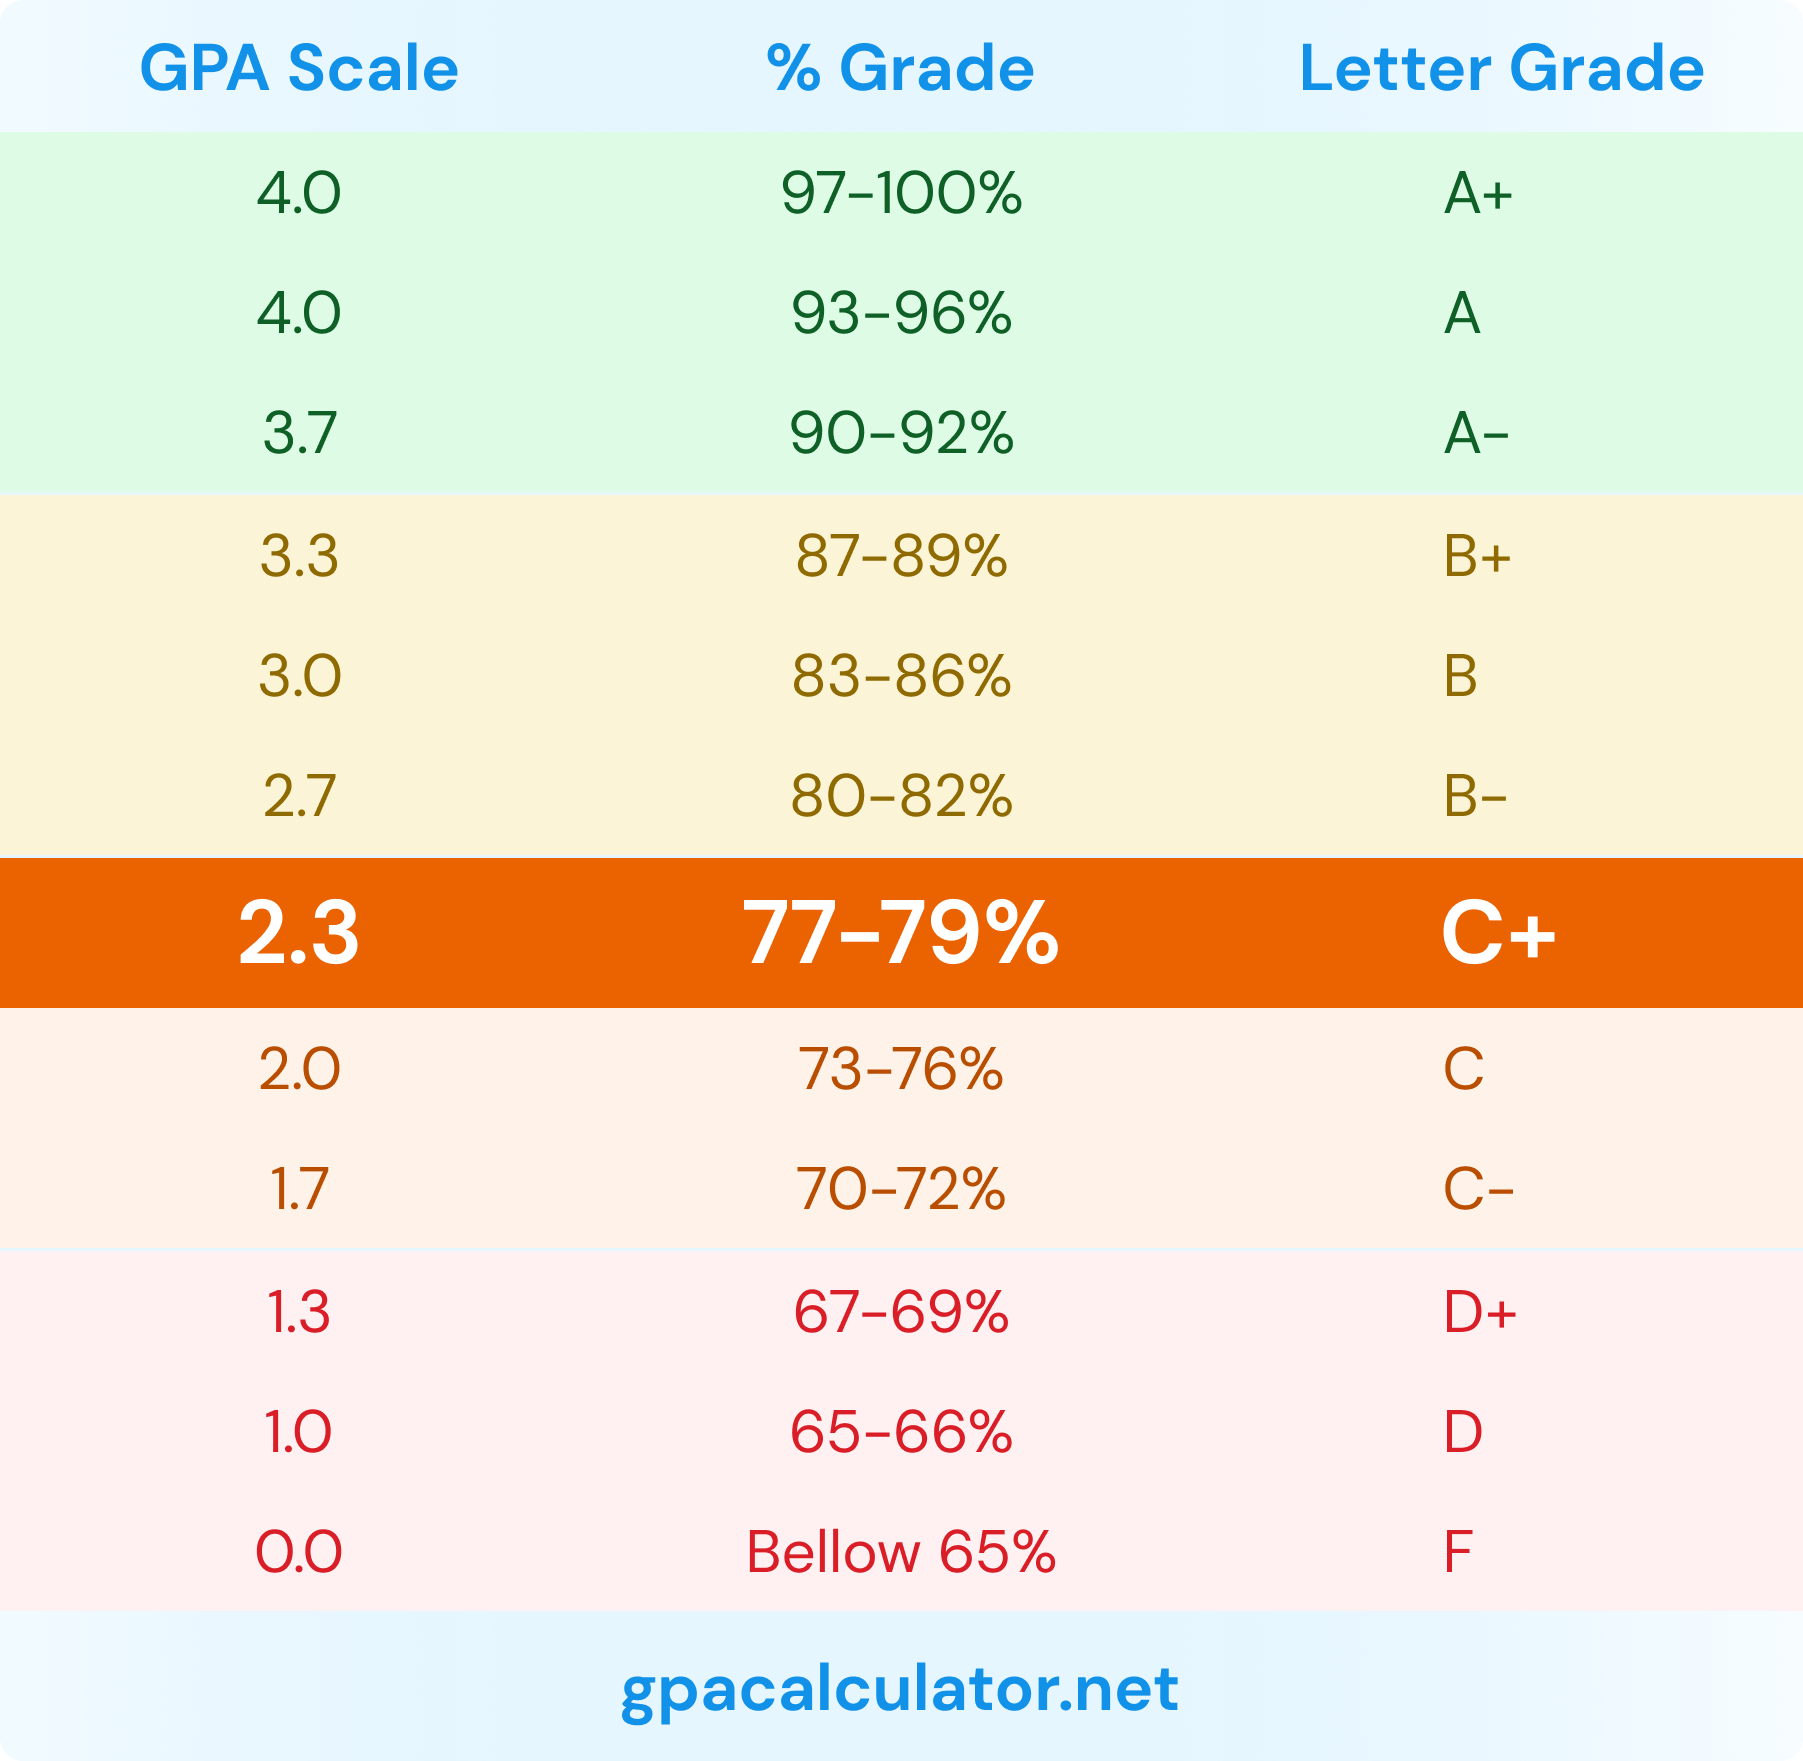