4 min læsning
07/30/2019
Mind The Graph Scientific Blog er beregnet til at hjælpe forskere med at lære, hvordan man kommunikerer videnskab på en ukompliceret måde.
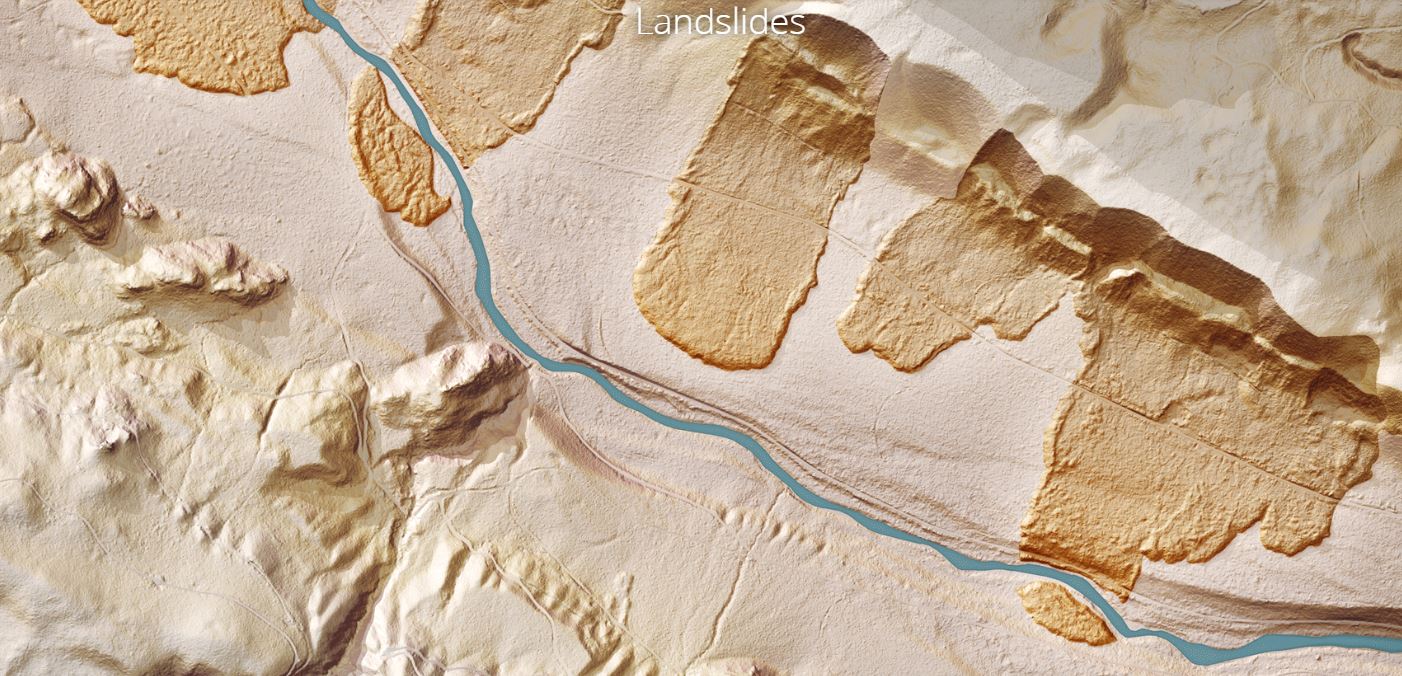
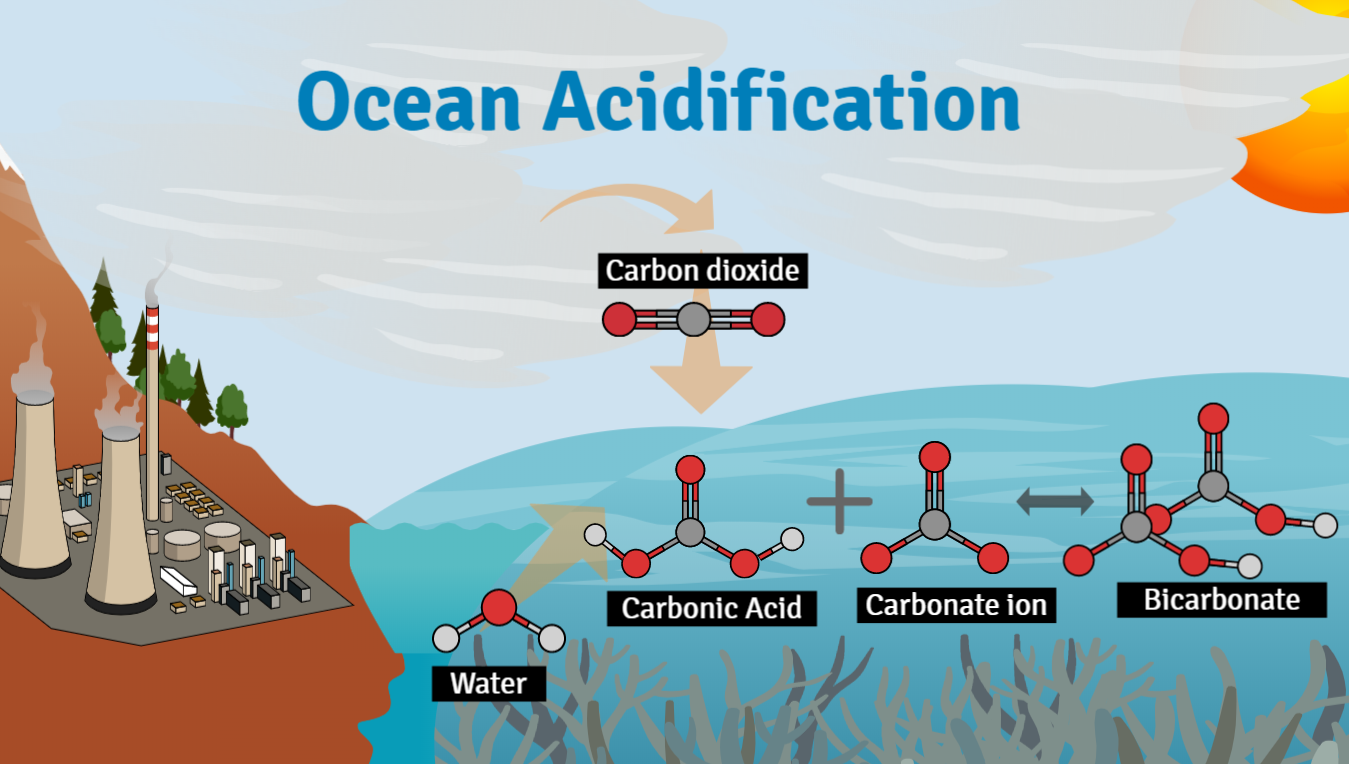
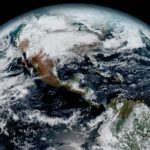
Klimaforandringer er et kontroversielt emne i disse dage. Vi kan se benægtelse og skeptiske mennesker overalt på de sociale medier. Men hver dag kommer forskere med nye data, der øger bevidstheden om konsekvenserne af vores vaner. Men er mennesker virkelig årsag til den globale opvarmning? Ifølge videnskaben, ja. Nu er tre undersøgelser offentliggjort på Nature i [...]
Hej med jer! At være forsker betyder at være opdateret på alt, hvad der har med videnskab at gøre. Endnu mere, [...]
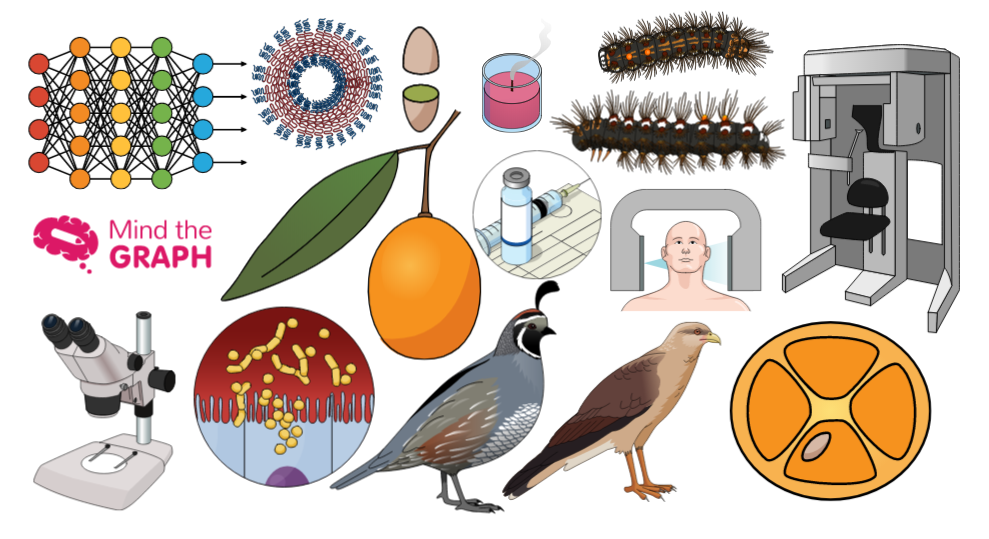
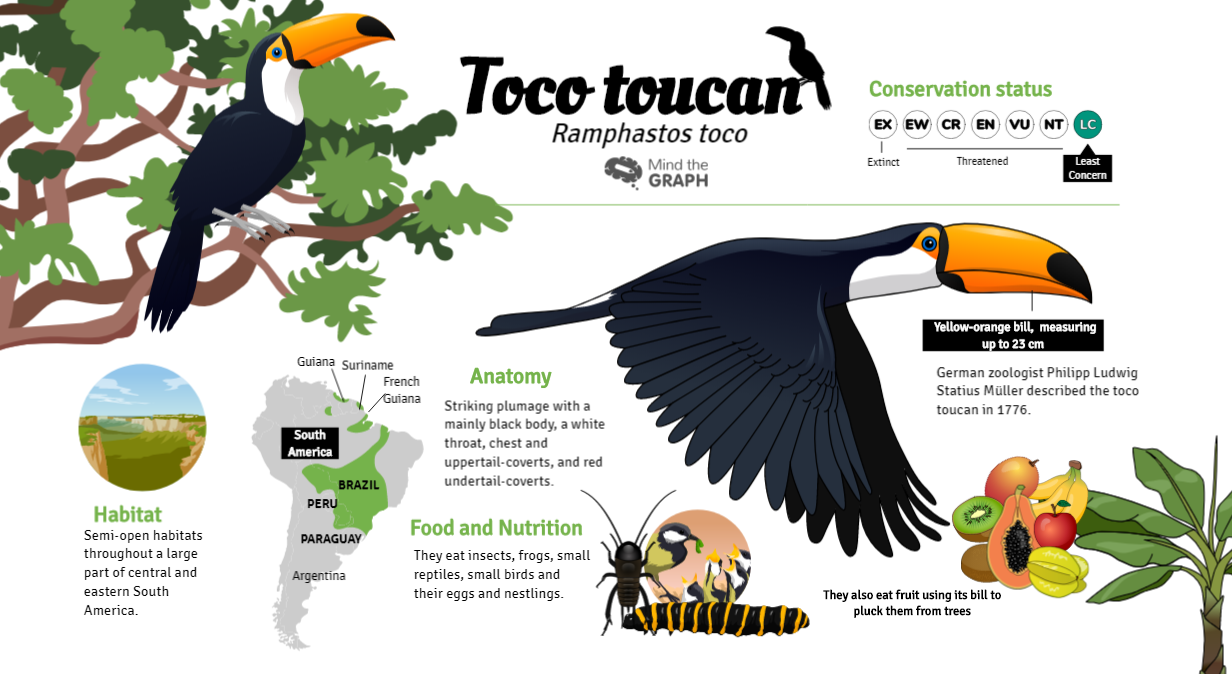
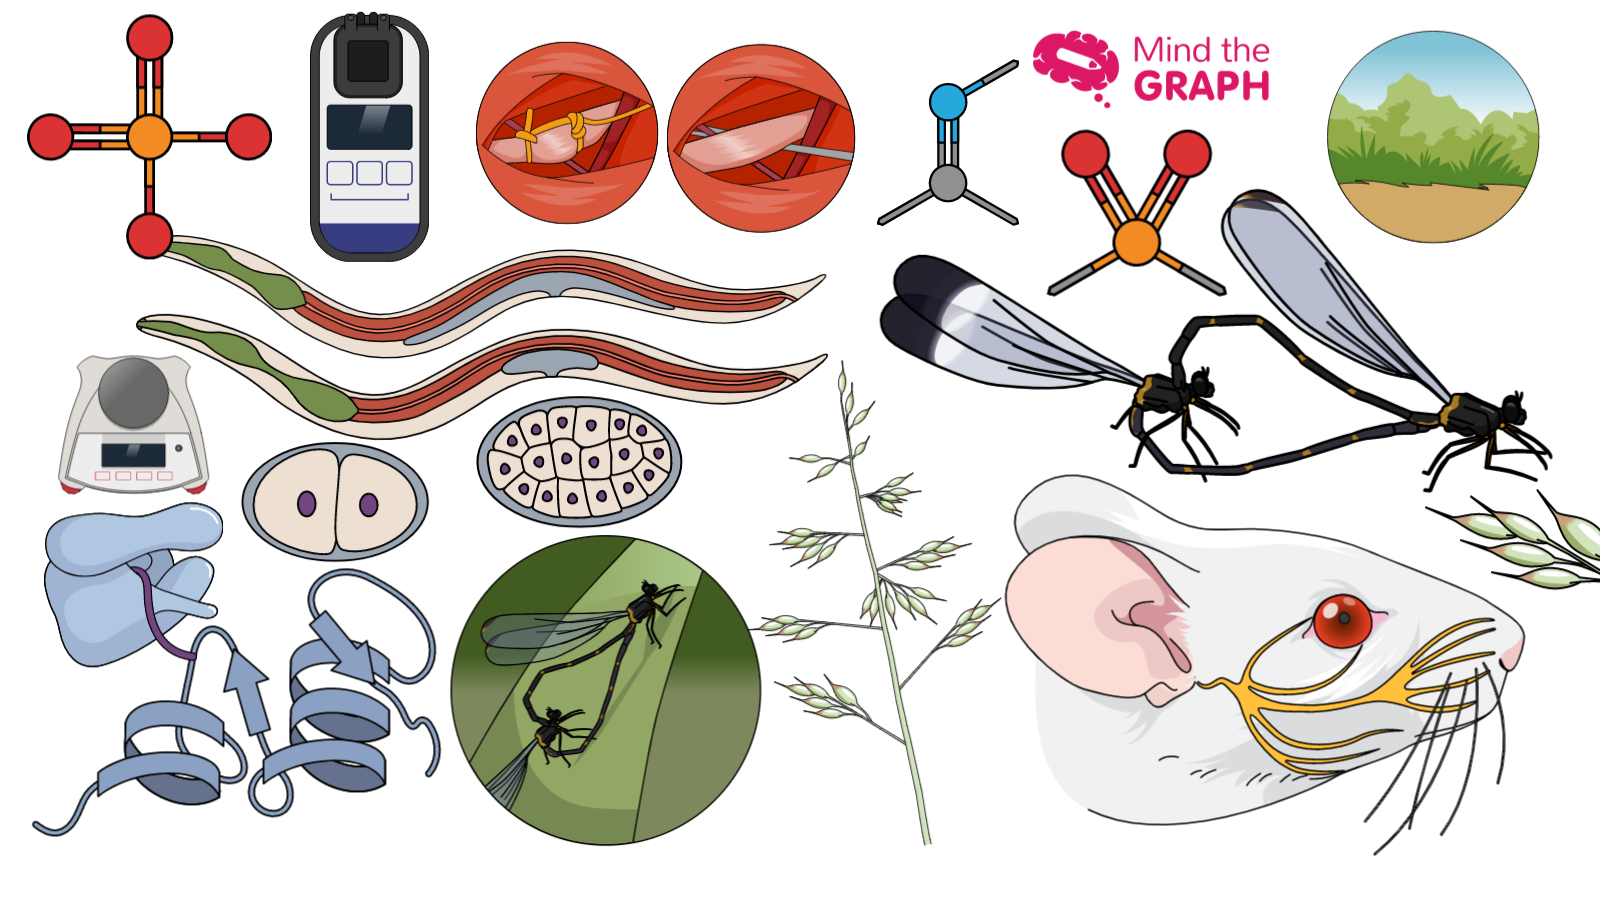
Fredag er dagen, hvor vi viser vores nye videnskabelige og medicinske illustrationer frem. Vi har allerede [...]
Videnskab kan ændre verden. Det betyder, at vi som forskere har en enorm magt. [...]
At fange og fastholde børns og teenageres opmærksomhed er ikke en let opgave. Men [...]
Hvis du er videnskabsmand, læge, studerende eller forsker, ved du, at det at lave præsentationer er [...].
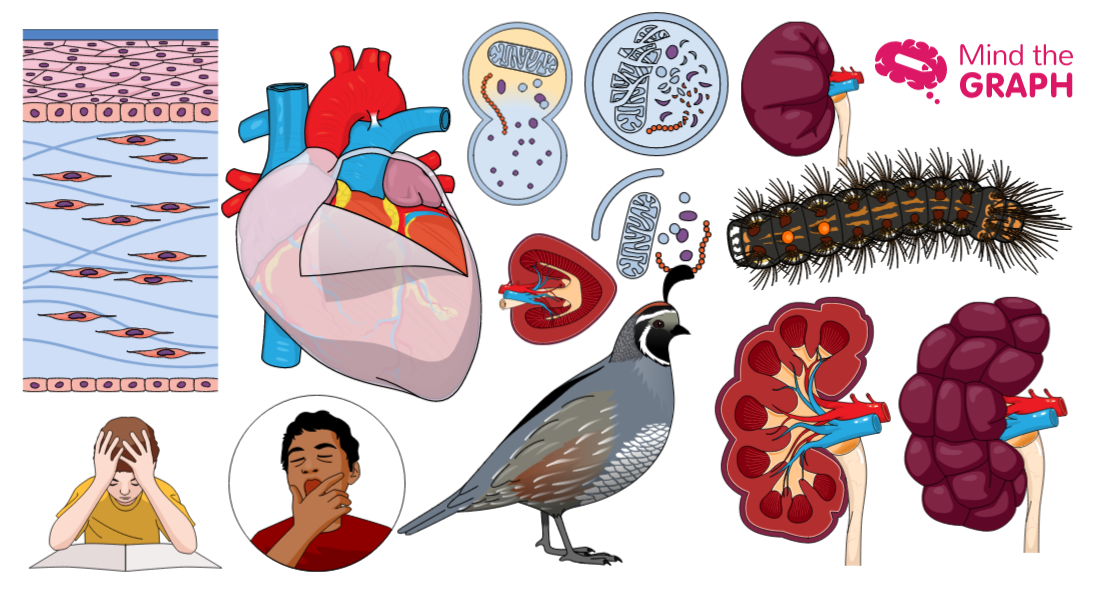
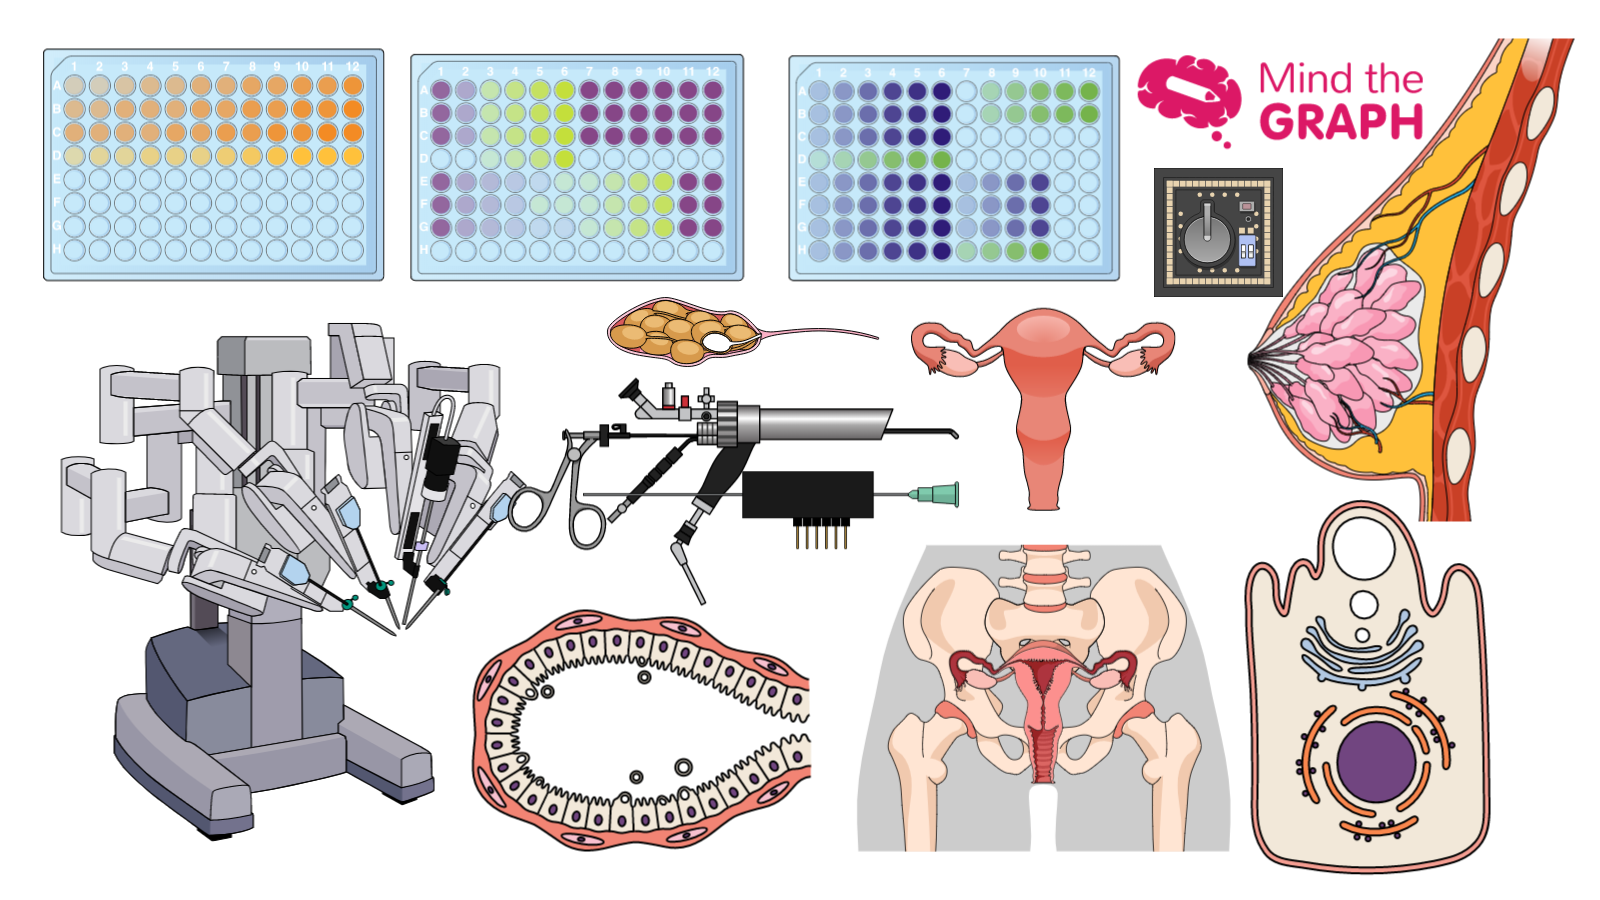
Fredag er dagen, hvor vi viser vores nye videnskabelige og medicinske illustrationer, der giver [...]
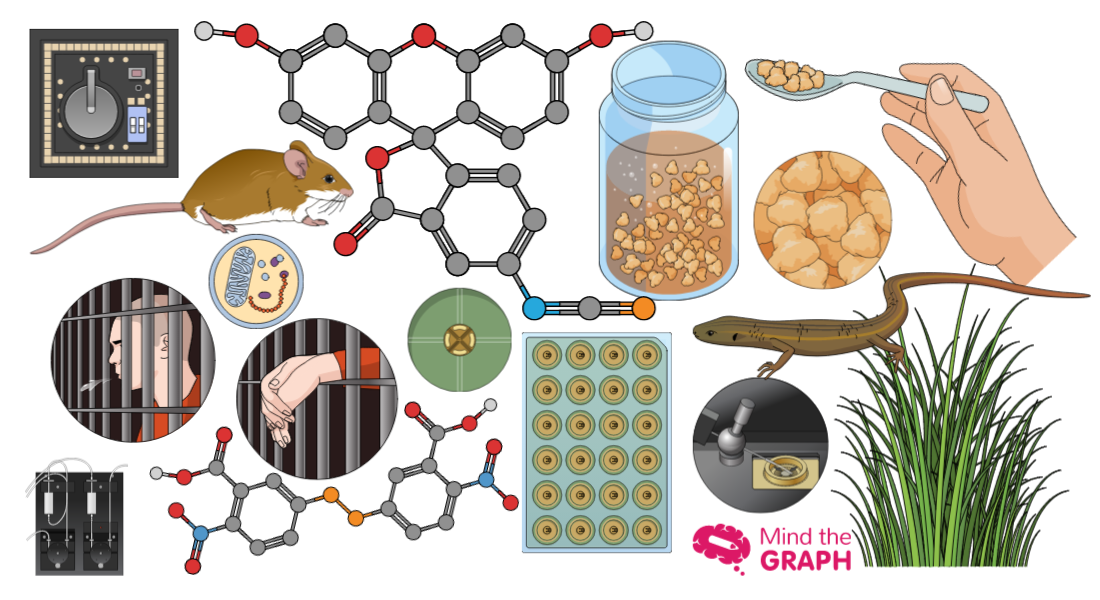
Hej med jer! Fredag er en dag, hvor vi viser de nye videnskabelige illustrationer. I denne uge har vi tilføjet flere [...]
Forklarer du videnskab og komplekse videnskabelige emner på en forståelig måde? Det er ikke en [...]
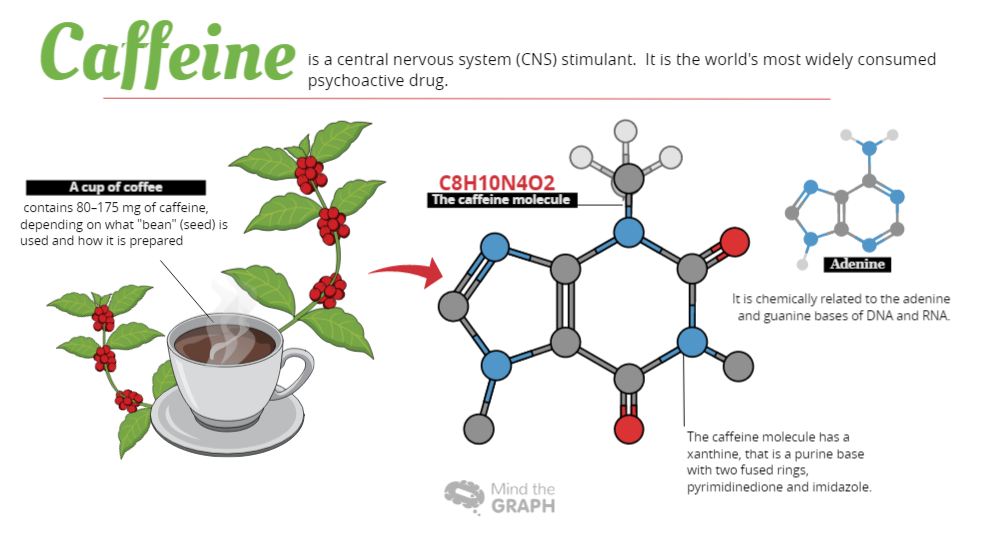
Fik du en kop kaffe i morges? En del af en forskers sociale liv er [...]
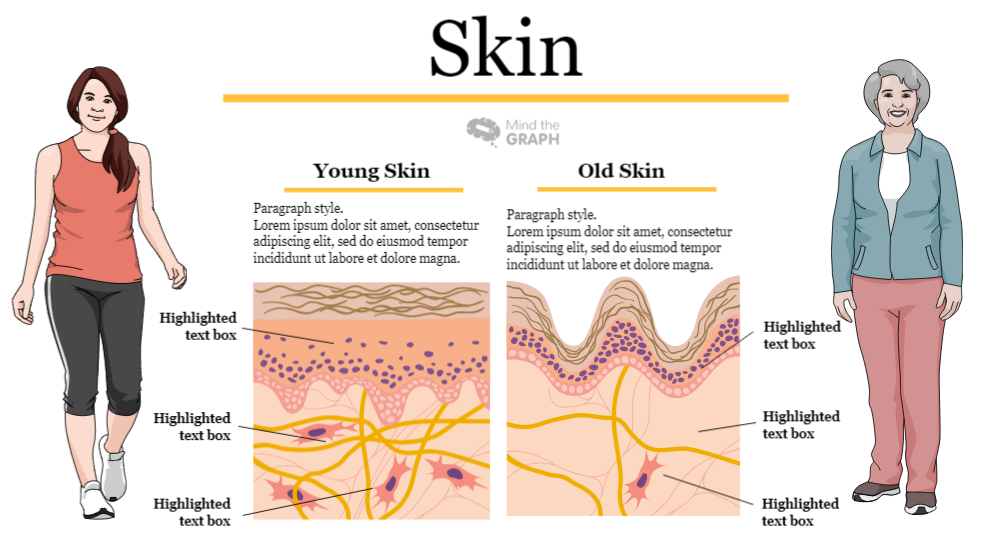
Hej, det er tid til at vise de nye videnskabelige illustrationer fra Mind the Graph. Vi har allerede [...]
For at kommunikere vigtigheden af videnskab i vores samfund skal vi først kunne [...].
Como você sabe, todas as sextas-feiras compartilhamos as novas ilustrações que adicionamos no Mind the [...]